[ad_1]

benimage/iStock via Getty Images
As stock prices are cratering across the board, with the pandemic winners and speculative growth echelon bearing the brunt, dividend-paying equities offer relief for investors watching painful unrealized losses.
Truly, those financially viable players that are valued adequately and ideally more or less immune to inflation can continuously reward shareholders with dividends, thus offering a safer haven amid the market storm, even if their share prices depreciate. Investors in the non-profitable growth echelon do not have that luxury.
There are a plethora of options to invest in dividend-focused funds, with the First Trust S&P International Dividend Aristocrats ETF (NASDAQ:FID) being among them. FID’s strategy mixes quality non-U.S. stocks with dividend growth stories (with nuances) encompassing no less than ten consecutive years. It is mostly similar to the SPDR S&P Global Dividend ETF (WDIV), though with one major caveat: it decidedly shuns U.S. stocks. Thus, it exposes investors to greater FX risk, which is now relevant more than ever given the interest rate differentials between the U.S. and a few other developed markets. However, it still has hidden exposure to the USD, and a meaningful one. Besides, its historical returns somewhat surprised me. Does these make the ~4.8% yielding international DGI basket a Buy? Let us discuss.
Investment strategy
The first thing to understand about the ETF is that it underwent a major strategy turnaround in August 2018, when it abandoned the NASDAQ International Multi-Asset Diversified Income Index and changed its ticker to FID from YDIV, adopting the indicated annual dividend yield-weighted S&P International Dividend Aristocrats Index. In this regard, its past returns and distributions trends before it replaced the benchmark are essentially irrelevant given massive differences in the strategies, thus I am ignoring them in the article.
As said above, the index is in many ways akin to the S&P Global Dividend Aristocrats Index tracked by WDIV, with the principal difference being the absence of U.S. dividend growers.
The selection universe is liquid players from the S&P Global BMI. To qualify for inclusion, a company must have no less than a $1 billion float-adjusted market capitalization and increase its dividends (or, an essential nuance, keep them stable) for no less than ten consecutive years. Dividend yield and payout ratio serve as an additional quality screen to cut off potential yield traps of the list. In this pool, 100 stocks are taken for further consideration; only 20 stocks per one country are allowed, as well as only 35 from one GICS sector.
Its underlying index is rebalanced only once a year, when constituents are recalibrated assuming country & sector weights are limited to 25%, and with each constituent’s weight not exceeding 3%.
That is to say, FID is essentially a product for investors who would like to 1) diversify away from the valuation risks inherent to the U.S., opting for cheaper (higher-yield) international equities with seemingly resilient dividend growth stories, and 2) benefit from FX tailwinds in case they materialize. The first point seems completely valid as the FID webpage displays a Price/Earnings ratio of 10.56x and a Price/Book ratio of slightly north of 1x. The second is a bit more complicated.
FX considerations. Hidden exposure to the U.S. dollar not to ignore
The key currency influencing FID’s returns is the Canadian dollar, given its investments in stocks like Keyera (OTCPK:KEYUF), TC Energy (TRP), Canadian Utilities (OTCPK:CDUAF), etc. Overall, Canadian players account for over 26% of the net assets spread between 19 holdings in the 76 equities-strong portfolio, thus exposing FID to the significant CAD devaluation risk in case the Bank of Canada’s markedly hawkish stance fails to shore up the loonie bulls’ confidence.
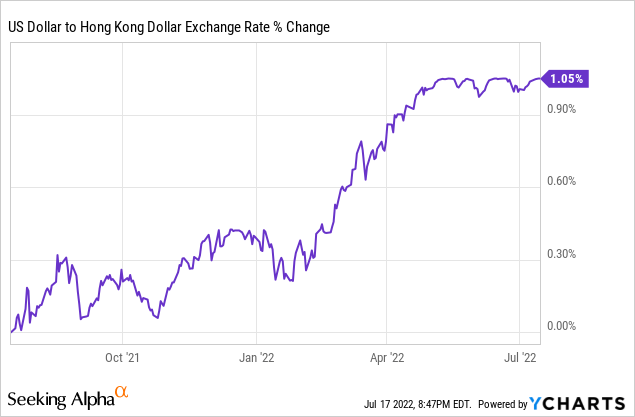
The Hong Kong dollar comes second, with 12 stocks accounting for ~19%, and here the unobvious exposure to the USD comes to light. The HKD has been pegged to the greenback since 1983, which means in case the exchange rate drifts out of the 7.75-to-7.85 target range introduced in 2005, the Hong Kong Monetary Authority (a de facto central bank) would act accordingly. For example, in June, it was buying the HK dollar at a meteoric pace to save it from depreciating as interest rates in the U.S. shoot higher.
It does not mean the HKD has a set-in-stone exchange rate; yes, it does fluctuate marginally over time. But the currencies are tightly correlated, thus minor depreciation of the Hong Kong dollar observed this year is more of a temporary fluctuation, and I do not anticipate the rate to deviate materially from the target range going forward.

As quarterly holdings reports illustrate, FID’s exposure to the HKD was rather fluid in the past, e.g., it stood at 13% in June 2020 but then rose to 17.3% in June 2021, so I see no strong reason to surmise it will remain at the same level next year in case a few HK equities drop out of the basket due to a dividend cut or any other meaningful reason.
The third currency that can disappoint the FID investors seeking value overseas is the yen (13 holdings, over 16% of the net assets), as the Bank of Japan is basically the last central bank amongst major economies unwilling to increase interest rates.
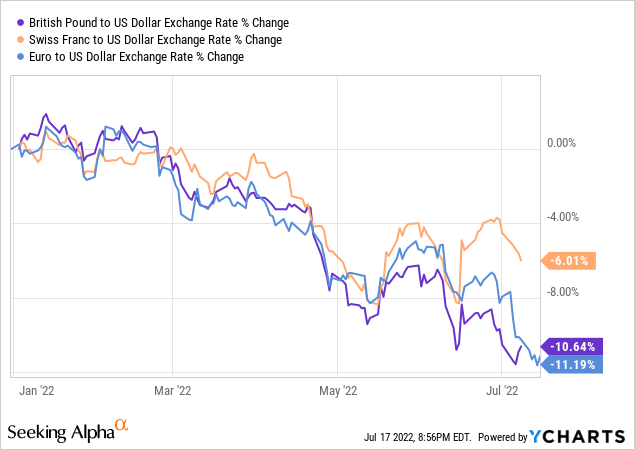
FID also has exposure to the Swiss franc and the pound sterling, as well as to the euro, which is now teetering around record lows due to the energy market headwinds and the recession risk.

EM equities also can be found, though in trace amounts. E.g., the fund holds (~1.5% weight) the Mexican peso-denominated shares in Arca Continental (OTCPK:EMBVF).
Performance: strangely strong returns despite lack of footprint in the U.S. stocks
At first glance, the FX factor touched upon above looks like a potentially significant detractor from FID’s historical returns (over the relevant period, given the trade war, pandemic-related headwinds, etc.). In reality, the picture is more complicated.
From September 2018 to June 2022, FID delivered almost the same CAGR as its peer WDIV, 2.31% vs. 2.39%, with higher fees (60 bps vs. 40 bps) being among detractors, while the Sharpe, Sortino ratios are identical. Moreover, from September 2018 to March 2020, FID actually outperformed, delivering an over 6% CAGR vs. WDIV’s 4.5%.
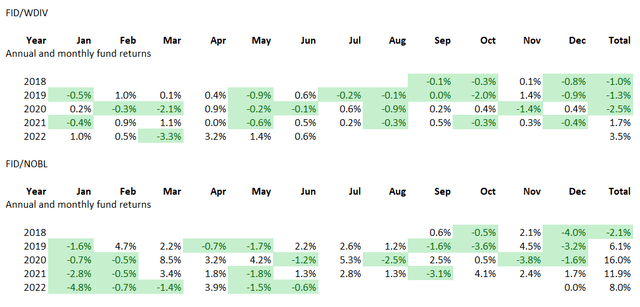
For better context, the table below combines the monthly returns data to illustrate whether its strategy was capable of routinely (or sporadically) beating its U.S.-tilting counterpart as well as their more stringent peer ProShares S&P 500 Dividend Aristocrats ETF (NOBL) since the index change (from September 2018). Months and years when FID outperformed (e.g., declined less) are in green.

Created by the author using data from Portfolio Visualizer
As it can be seen, FID trounced WDIV in 2018, 2019, and even 2020. However, its purely U.S-focused counterpart with far stricter eligibility criteria did much better; it also sports a CAGR of 8.85% over the Sep-18 – Jun-22 period.
Final thoughts
I am of the opinion FID should not be considered at this juncture. It does have a comparatively appealing valuation profile, solid LTM yield of ~4.8% (forward yield is somewhat misleading as the June distribution has historically been higher compared to other quarters), and a rather appealing dividend growth profile.
Speaking of the latter, its LTM distribution is around 15.9% above the LTM figure from September 2019 when its new strategy delivered four quarters of distributions. Also, like its peer WDIV, FID is utilities-heavy, with a ~24.4% allocation, which gives it an aura of defensiveness.
However, these are insufficient for a bullish thesis. The risks are that the euro might fall even deeper (I do not regard the $0.95 or even $0.9 scenario as outlier cases no more) should energy market woes exacerbate inflation. The Great Recession is no longer the guide as the EUR was much more expensive back then and it is now trading at the early aughts’ levels. I also have little confidence that the yen, the loonie, and the pound sterling would appreciate vs. the USD given the Fed’s decisive inflation-fighting efforts. FID would be an interesting fund when the cycle is over, and the USD reverts lower after peaking. However, not now.
[ad_2]
Source links Google News

