[ad_1]

Gam1983/iStock via Getty Images
Introduction
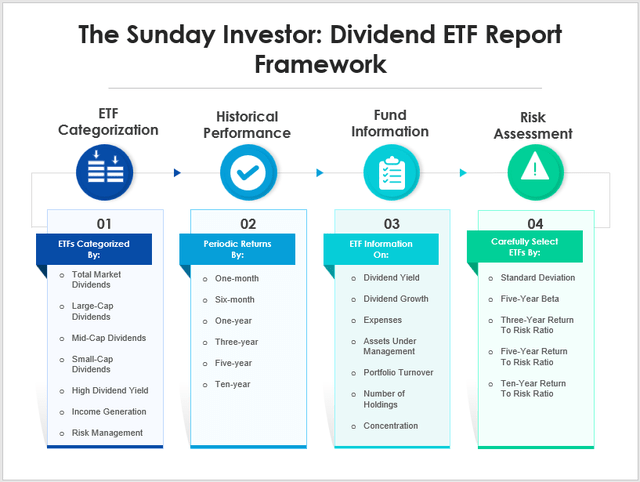
Welcome to the eighth edition of my monthly dividend and income ETF series! For new readers, my purpose is simple: to provide consistent, accurate, and reliable data on all U.S. dividend and income ETFs. These articles tend to be lengthy, but I hope it’s time well spent and that you walk away having a firm understanding of all your ETF options in your chosen category. Before we begin, here’s a summary of what you can expect each month:
The Sunday Investor
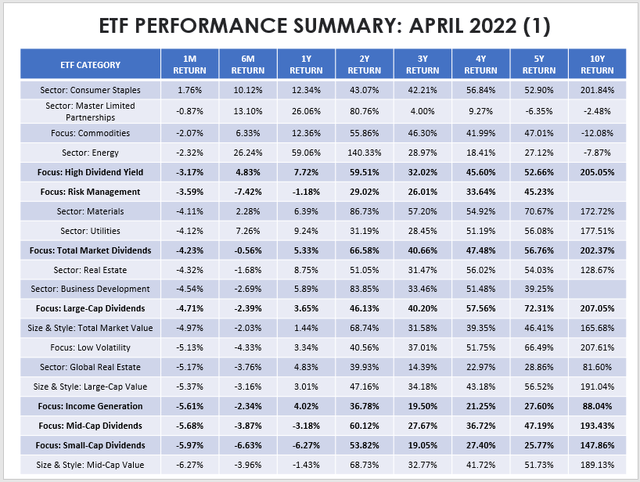
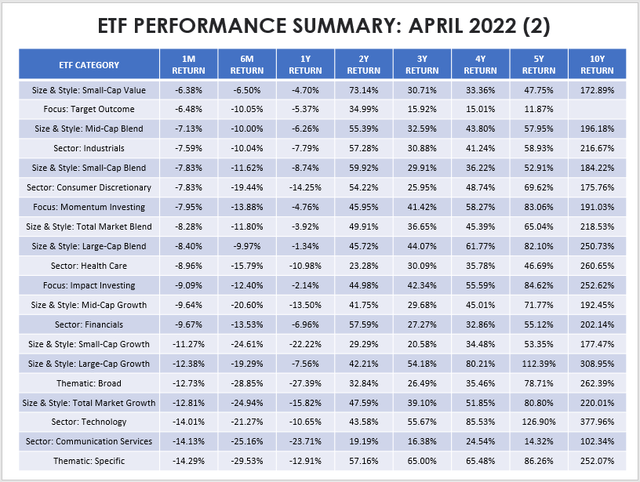
I like to start these articles by summarizing how the entire U.S. equity market performed last month. ETFs are a great way to do this since they’re diversified products, with most having a specific objective or following a particular style. The table below is a category performance summary of my entire U.S. equity ETF database (800+ ETFs), reflecting median returns sorted from best to worst in April. Needless to say, it was a tough month.
The Sunday Investor
The Sunday Investor
I want to make the following observations:
1. Low-beta sectors continue to do well, as you would expect in down markets. Consumer Staples was the best-performing, and I’ve continued to advocate for the Invesco Dynamic Food & Beverage ETF (PBJ), which has gained 6.01% in the last three months and is a leader in the category. The same goes for the Utility sector, home to the lowest beta equity stocks. In mid-March, I wrote this bullish article suggesting that the Utilities Select Sector SPDR ETF (XLU) was an effective insurance play, and it outperformed the SPDR S&P 500 ETF (SPY) by about 7% since. Many readers and some analysts assumed that the sector wasn’t a good investment due to rising treasury yields, but things are rarely that simple.
2. Again, high-dividend ETFs were the best dividend category last month, losing a median of 3.17% vs. SPY’s 8.78%. Total market and large-cap dividend ETFs were next, followed by mid-and small-cap dividend ETFs. You can see a clear progression in the tables, with the market favoring larger, less risky companies. There’s also a link between size and profitability. When you get down to the small-caps, profitability suffers, and I don’t advocate overweighting these stocks in uncertain markets.
3. Thematic ETFs, including the ARK Innovation ETF (ARKK), the First Trust Water ETF (FIW), the BlackRock U.S. Carbon Transition Readiness ETF (LCTU), or the SPDR S&P Kensho New Economies Composite ETF (KOMP), were among the worst investments. These ETFs market themselves as great diversifiers, but only two (FEDX and AMER) out of 22 generated positive returns over the last three months. In my view, the thematic approach to portfolio management is still unproven, and straightforward sector allocation decisions matter most. There’s no need to overcomplicate things and certainly no need to pay well-above-average fees.
That’s my general take on the current market, but now, let’s look at how dividend and income ETFs performed last month.
Total Market And Large-Cap Dividend ETFs
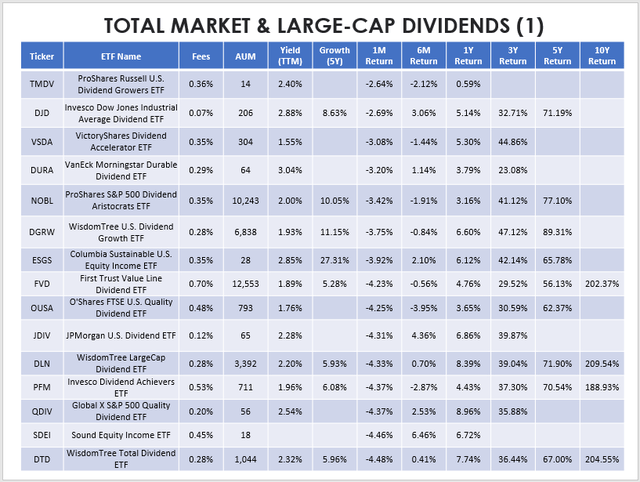
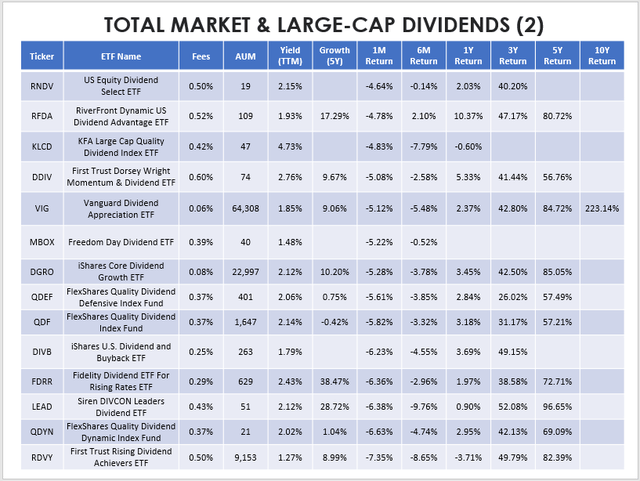
There are 29 ETFs in these two categories, and most performed well in April, albeit none of them turned a profit. Standouts included the ProShares Russell U.S. Dividend Growers ETF (TMDV) and the ProShares S&P 500 Dividend Aristocrats ETF (NOBL), posting losses of 2.64% and 3.42% despite severely lagging their peers over the last six months. The reason is not that their strategies are superior, but rather because they have virtually no tech exposure. To illustrate, the Vanguard Information Technology ETF (VGT) lost 11.83% in April, so again, I encourage investors to focus on a fund’s sector allocations rather than the specific strategy.
Recall how I considered the Invesco Dow Jones Industrial Average Dividend ETF (DJD) a bargain in February, and it continued to perform well in April. I still think its fundamentals are among the best in the large-cap dividend category. Still, preliminary results this earnings quarter suggest slowing growth prospects, so I will want to make sure DJD hasn’t gone too deep into the value end of the pool. Readers can expect a thorough update this month.
The Sunday Investor
Many ETFs operate by eliminating non-dividend-paying companies in a wide stock universe, like the WisdomTree LargeCap Dividend ETF (DLN). Others, like the Invesco Dividend Achievers ETF (PFM), require ten consecutive years of dividend growth. PFM is interesting because ten straight years of dividend growth would be impressive ten years ago. Now, maybe not so much. In a recent review, I found PFM to be bloated, so take some time to think about how difficult it is for a security to qualify for an Index. If it’s too easy, you might want to default to a lower-cost broad-based Index fund.
This next table shows the bottom performers in the total market and large-cap dividend category last month. Here, you’ll find the Vanguard Dividend Appreciation ETF (VIG), which is the largest by AUM. In part, I’m sure its size is due to its low 0.06% expense ratio, but that shouldn’t be the main reason you buy an ETF. When you get down to expense ratios below 0.20%, those fees have only a marginal impact on returns. You can use this calculator to run different scenarios, but it’s best to choose a fund with a sound strategy and solid fundamentals first. If the fees happen to be low, consider it a bonus.
The Sunday Investor
I’ve recently downgraded a couple of these ETFs, including VIG and RDVY, and tried to manage expectations for the iShares Core Dividend Growth ETF (DGRO). In my view, DGRO is superior to VIG because investors are getting a higher yield and dividend growth (2.21% and 10.20% vs. 1.85% and 9.06%). DGRO is also trading at a forward price-earnings ratio of about three points less with a similar forward EPS growth rate of around 15%. YTD, these superior features have also shown up in total returns, with DGRO outperforming VIG by 1.50%. I think it’s the better core holding.
Small And Mid-Cap Dividend ETFs
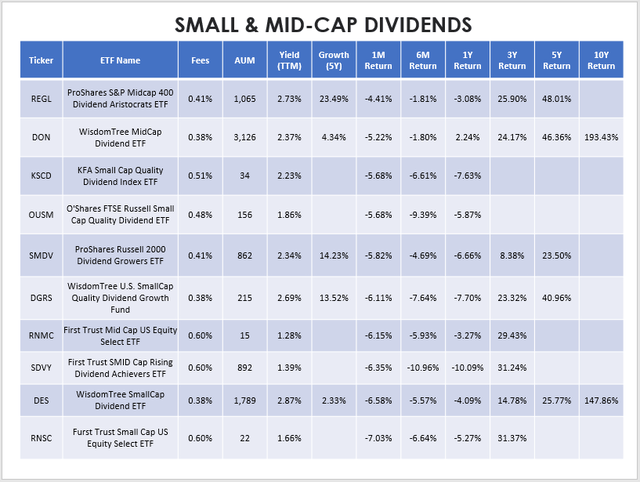
Large-cap dividend ETFs make for great core holdings, but you can select from the following ten small- and mid-cap dividend ETFs to further diversify. As hinted earlier, these ETFs will often decrease the quality and increase the risk of your portfolio, as many of the underlying holdings aren’t as profitable. However, they allow you to capture an entirely different market segment and let you customize your exposures a bit better than total market dividend ETFs would. On the downside, these funds tend to be costly, so avoid holding them for long periods.
The Sunday Investor
You can see that none were great options for April, but in the last year, the WisdomTree MidCap Dividend ETF (DON) produced a gain of 2.24% and has the lowest fees in the category (0.38% expense ratio). For April alone, the ProShares S&P MidCap 400 Dividend Aristocrats ETF (REGL) did best. In the case of REGL, qualifying companies require 15 consecutive years of increases rather than the 25 needed for the large-cap NOBL. Still, the main driver of the outperformance was its lack of tech exposure.
High Yield Dividend ETFs
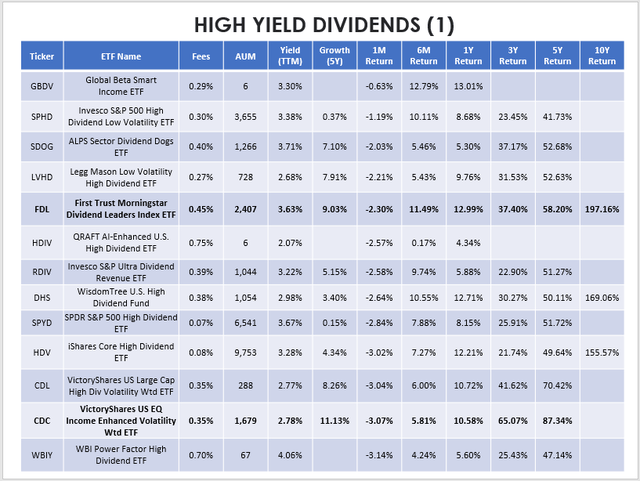
High-dividend ETFs were the best-performing dividend category last month, and it’s been that way for the better part of the year, too. The reason isn’t just because dividends provide a margin of safety. Typically, high-dividend stocks are less volatile than the market and are commonly found in the defensive sectors like Consumer Staples, Financials, and Utilities. Throw the Real Estate sector in there, too, since these securities provide a solid level of protection in inflationary environments. Low growth rates haven’t bothered ETFs in this category yet, so as long as sentiment toward growth stocks remains muted, they should continue to perform well.
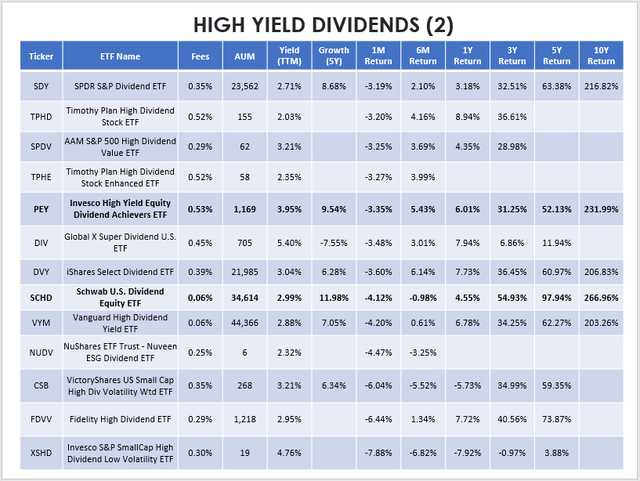
The tables below highlight 26 high-dividend ETFs for you to consider. Most have low dividend growth rates, but I’ve bolded ones with solid five-year histories.
The Sunday Investor
The Sunday Investor
As shown, options are few and far between for those wanting a high yield and dividend growth. The only ones I found were:
- First Trust Morningstar Dividend Leaders ETF (FDL)
- VictoryShares US EQ Income Enhanced Volatility Weighted ETF (CDC)
- Invesco High Yield Equity Dividend Achievers ETF (PEY)
- Schwab U.S. Dividend Equity ETF (SCHD)
You can add the iShares Core High Dividend ETF (HDV) to the list if you’re looking at the dividend growth rates of current constituents, but other than these ETFs, single-digit growth is the norm for the category. In my view, it’s no wonder SCHD is the preferred pick for many dividend investors. It has low fees, a solid yield, double-digit dividend growth, and an exceptional track record.
Perhaps the rest are better suited as satellite holdings since they seem to only perform well in certain situations. Let’s take a brief look at three of the more popular ones:
Invesco S&P 500 High Dividend Low Volatility ETF
SPHD begins by ranking all S&P 500 securities by their trailing dividend yields and then removing the 25 most volatile ones (using one-year price returns) to form a 50-stock Index. Security weights are capped at 3%, and there can be no more than ten securities per sector. Note that dividend yield is still the primary screen; you can still end up with only a moderately low-risk portfolio, but that’s not the case today. When I reviewed the ETF in March, SPHD’s five-year beta dropped to 0.77. Today, it’s 0.76, making it the second-lowest in the category. The lowest is 0.71 and belongs to the Legg Mason Low Volatility High Dividend ETF (LVHD). From the earlier tables, LVHD was the fourth-best-performer last month, losing just 2.21%.
SPHD and other ETFs like it have certainly done their jobs well through this correction. The issue is not knowing when the bottom is in. What concerns me with SPHD is its constituents’ low revenue and earnings per share growth rates of just 4.98% and 5.98%. These rates will likely further reduce as we progress through earnings season, so in my view, current investors are playing with fire. They’re enjoying the downside protection right now, but that’s likely to be erased quickly once market sentiment improves. For more information on low volatility ETFs, read my recent category writeup here.
SPDR S&P 500 High Dividend ETF
SPYD is one of the most popular ETFs in this category due, in part, to its low expense ratio of 0.07% and its simplicity. It selects the top 80 dividend-paying stocks in the S&P 500, rebalances at the end of January and July, and that’s pretty much it. Its beta is relatively high at 0.94 and underperformed SPHD by about 1% YTD. However, its growth rates are a bit better, so arguably, it should eventually make a comeback.
SPYD’s 3.67% trailing yield is a standout feature, but this can be a bit of a double-edged sword. You might have noticed its paltry 0.15% five-year dividend growth rate, with annual distributions increasing from $1.5543 to $1.5658. In particular, December’s $0.1276 distribution sent some investors running for the hills if this article’s comment section is any indication. Fluctuating distributions aren’t an issue for total return investors, but it can be a nightmare for those using ETFs as a source of reliable, consistent income. From what I can tell, December’s distribution dipped for two reasons:
1. The ETF made its distributions before several underlying holdings made theirs. You can’t distribute what you don’t have, and investors had to wait until March to be topped up.
2. SPYD experienced a significant increase in units outstanding in the weeks leading up to the ex-dividend date. While this doesn’t affect the fund’s NAV, it will dilute the dividend payment. Since the fund didn’t receive more dividends from its underlying holdings, everybody got less of the pie. SPYD is especially vulnerable since some investors only buy it for its anticipated high dividend payment.
These fluctuating payments aren’t accidents but are features of ETFs and make predicting distributions challenging. If you’re using dividend income to pay the bills and need them to be consistent and reliable, individual stocks are more appropriate.
SPDR S&P Dividend ETF
It’s not in the title, but SDY is another Dividend Aristocrats ETF holding securities across the S&P 1500 Composite Index that have increased dividends for 20 consecutive years. Some investors appreciate this consistency, while others (including me) think the growth requirement is too strict. SDY yields 2.71% and has grown distributions by an annualized 8.68% in the last five years. Unlike NOBL, which is equal-weighted, SDY is forward-yield-weighted and rebalances each quarter, ensuring a relatively higher yield. SDY is also reasonably well-diversified across all sectors (except Technology), so it appears to check many boxes for dividend investors.
I last reviewed SDY in November, and while it’s outperformed the S&P 500 by a wide margin, it’s also underperformed most other high-dividend ETF peers. In the six months from November to April, SDY gained 2.10%, putting it in 19th place out of the 26 listed in the tables above. It’s ranked 18th in the last three months, so it hasn’t been a strong investment even during a period where Dividend Aristocrats are supposed to shine. SDY’s constituents have a weighted-average forward P/E ratio of about 19, so it’s far from cheap.
Income Generation And Risk Management
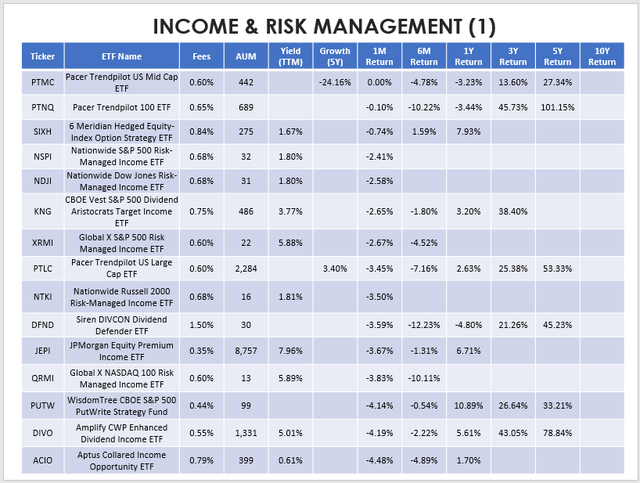
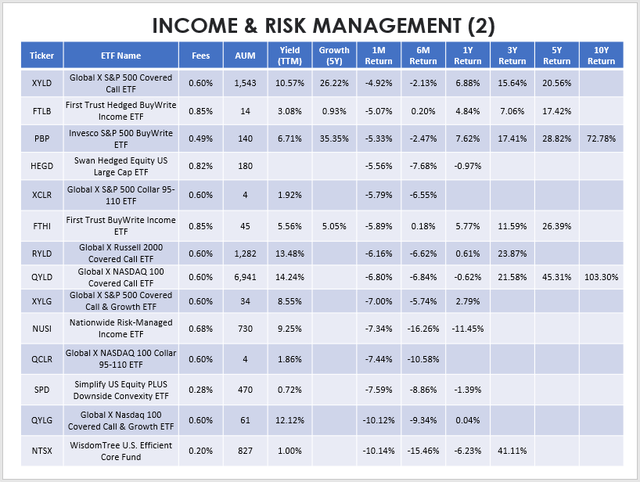
While all ETFs are subject to fluctuating and unpredictable distributions, choosing an income-focused product that uses covered calls to boost distributions can increase your chances. Risk management ETFs often do the same but use some proceeds from writing call options to purchase put options. There are a lot of new products popping up lately, each claiming to have a superior strategy. It’s difficult to say since the performance histories are so short, but we’re beginning to understand how effective these ETFs are in down markets. Look at the 29 in my database below, sorted from best to worst-performing in April.
The Sunday Investor
The Sunday Investor
Two Pacer ETFs (PTMC and PTNQ) were flat last month, and that’s because their strategies allow for fluctuation between equities and treasuries. In the case of PTNQ, its five-year 101.15% return stands out, so it’s worth looking into more.
The largest ETF by AUM in these two categories is the JPMorgan Equity Premium Income ETF (JEPI), which I reviewed last year. JEPI writes covered calls on the S&P 500 through equity-linked notes, or ELNs, making it more mysterious than its peers. JEPI has ranked #5 out of these 29 ETFs in the last six months, losing 1.31%. In the previous year, it also ranked #5, producing a gain of 6.71%. By comparison, the SPDR S&P 500 ETF (SPY) lost 8.14% in the last three months and gained 0.04% in the previous year. I’d say JEPI investors are more than happy with these results.
In contrast, the Nationwide Risk-Managed ETF (NUSI) has been a huge disappointment. NUSI benchmarks against the CBOE S&P 500 Zero-Cost Put Spread Collar Index, but it employs a net-credit collar strategy, meaning it doesn’t use all of the covered-call-writing option income to purchase protective puts. As a result, you’ll receive less distributions but more downside protection, which could be a worthwhile trade-off. Last month, NUSI lost 7.34% vs. 13.60% for the Invesco QQQ ETF (QQQ), providing a decent level of protection. However, NUSI still didn’t do well against other Nasdaq-100-related ETFs. In the last three months, it’s lost 10.26%, good enough for second-worst-place in these two categories. Meanwhile, QQQ is down 13.61%, QYLG is down 8.84%, and QYLD is down 3.97%. Even the Global X NASDAQ 100 Collar 95-110 ETF (QCLR), which seeks to lessen drawdowns to approximately 5% from the purchase of the put to the options’ expiration in three months, has done much better (losing 6.86% in the last three months). Therefore, one can conclude that NUSI’s portfolio managers have done a poor job, at least through this recent correction.
Risk Analysis
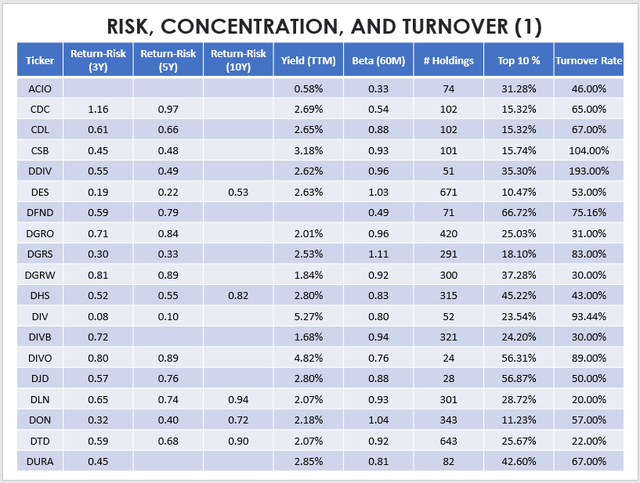
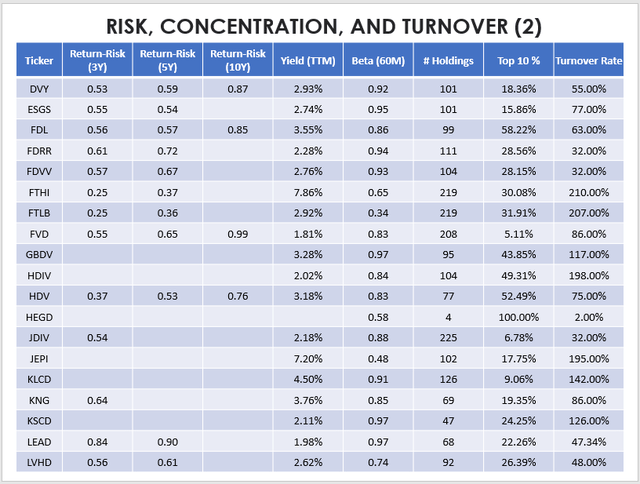
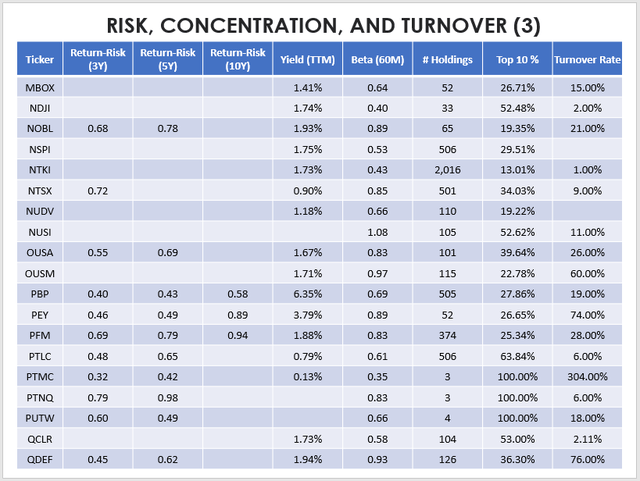
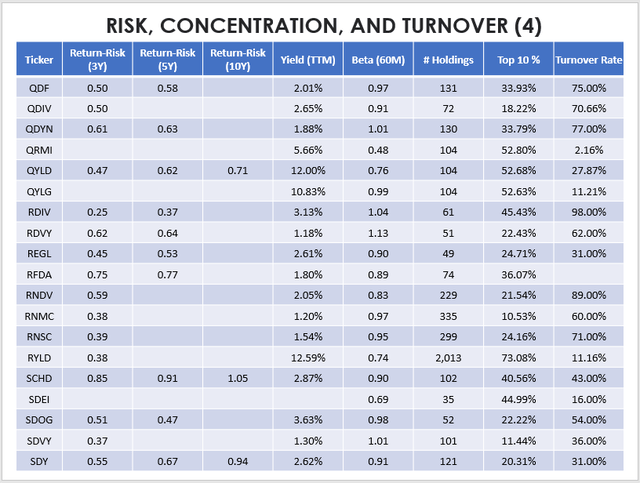
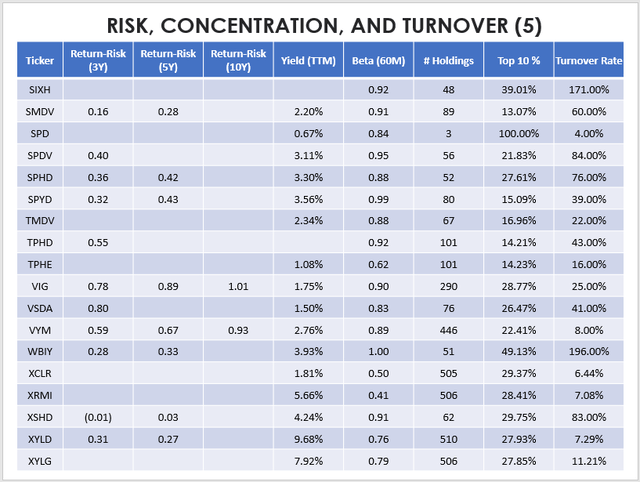
Finally, these next five tables provide additional risk, concentration, and turnover metrics for all ETFs listed in this article. As a quick review:
- Return-To-Risk Ratios: Annualized Return Divided By Annualized Standard Deviation
- Beta (60M): A Measure of Market Volatility Using The ETF’s Last 60 Months’ Worth of Returns
- Turnover: How Quickly Securities Were Bought And Sold Over The Last Year
We obviously want high return-to-risk ratios, but you may prefer varying levels of a portfolio’s beta and turnover. A low beta ETF is likely to perform well in a market downturn but may not perform so well in a bullish market. As suggested earlier, you may find it appropriate to choose these only during risk-off environments.
An ETF’s most recent turnover rate also provides clues about how “actively managed” it is. Generally, low-turnover ETFs are more likely to be broadly diversified and don’t require much attention since their holdings don’t change frequently. In contrast, high-turnover ETFs have significantly different holdings today than last year. Therefore, past metrics (performance, risk, growth, yield, etc.) may not be reliable anymore. This reality is why technical analysis of an ETF’s price patterns is often a meaningless exercise, especially when the analysis time frame crosses reconstitution periods.
The Sunday Investor
The Sunday Investor
The Sunday Investor
The Sunday Investor
The Sunday Investor
Market Outlook and Conclusion
In my view, having about 10% Energy exposure is crucial for any portfolio. It will add risk, but remember that rising energy costs are usually the main driver of inflation. If prices crash, then there’s a good chance some of your other investments will pick up the slack. Buy a few with complimentary features rather than trying to pick the best dividend ETF each month. A low beta and low P/E will help out should the market continue downward, but double-digit EPS growth will help in bullish periods. I’ve found five ETFs that meet these criteria, and I encourage you to check them out to see if they fit well in your portfolio.
- iShares Select Dividend ETF (DVY)
- WisdomTree U.S. High Dividend Fund (DHS)
- VictoryShares US EQ Income Enhanced Volatility Wtd ETF (CDC)
- iShares Core High Dividend ETF (HDV)
- VictoryShares US Large Cap High Dividend Volatility Wtd ETF (CDL)
Thanks for reading this lengthy post, and I hope you found this information valuable. I look forward to discussing this further in the comments section below.
[ad_2]
Source links Google News

