[ad_1]
J Studios/DigitalVision via Getty Images
My recent article about the Schwab US Dividend Equity ETF’s (NYSEARCA:SCHD) annual reconstitution provoked a great deal of discussion. Much of that discussion, as is usual here on Seeking Alpha, was made up of current investors in SCHD praising their investment. They have a lot to praise. But other readers raised valid questions about the Schwab US Dividend Equity ETF’s future.
SCHD Has Been the Best Income ETF Over The Past Decade. But Can It Continue?
The Schwab US Dividend Equity ETF has been a wonderful investment for investors seeking income over the past decade. Unlike other dividend ETFs, it has managed to provide a competitive dividend flow while also growing its share price enough to provide a total return that is not much different from that of the market proxy S&P 500.
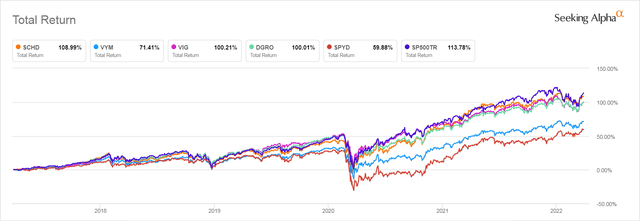
As you can see in the chart below, SCHD’s total return has been far better than that of the Vanguard High Dividend Yield ETF (VYM), The Vanguard Dividend Appreciation Index (VIG), the iShares Core Dividend Growth ETF (DGRO), and the equal weighted SPDR Portfolio S&P 500 High Dividend ETF (SPYD).
5-Yr Total Return of Top Dividend ETFs Compared to S&P 500
Seeking Alpha
This total return has not been achieved by sacrificing yield. Though as we will discuss later in this article, Seeking Alpha tells us that SCHD’s dividend over the past 12 months has been 2.83%. That is higher than the trailing 12-month yield of VYM, which Seeking Alpha tells us is 2.74%, as well as DGRO’s 1.99%, and VIG’s 1.74%. Only SPYD has a higher trailing 12-month yield of 3.56%. But as you can see, SPYD’s half a percent more yield has been compensated for by years of lagging share price appreciation which have given it a mediocre total return.
But all these numbers are looking back at the past–a past when dividend stocks were very popular with investors who had no other alternative for earning income. The best investments of the past often disappoint those who invest based on back testing. In this article, we will look at some factors that can help us decide if the approach that has let SCHD perform so well over the past will lead to continued out-performance going forward. To do this, we need to look more closely at what exactly it is that SCHD invests in.
Many Investors Aren’t Clear on How SCHD Chooses Stocks – Here are the Facts
One thing that emerged from the discussion provoked by my previous article is that many investors don’t seem to understand how SCHD picks the stocks that make up the ETF.
Last year when I raised concerns about SCHD’s future, I was told not to worry because every year SCHD changes the stocks it holds. But though it is true that SCHD eliminated quite a few stocks during its annual reconstitution in March of 2021, they did this after the Pandemic–which struck stocks right after the 2000 reconstitution, led to a rash of dividend cuts and freezes.
When I reviewed SCHD’s holdings after this year’s reconstitution, I found that this year SCHD’s holdings have hardly changed at all, even though some of them don’t look like stocks that dedicated dividend and dividend growth investors would buy at their current prices. Indeed, several commenters expressed surprise that some stocks that they considered to be poor investments right now for various reasons were still important parts of SCHD, in particular, IBM (IBM) and Home Depot (HD).
To understand why SCHD has not made significant changes, we need to take a closer look at exactly how SCHD picks the stocks it holds. SCHD is a passive ETF. That means it tracks the holdings of an index and only changes what it buys and sells when the index changes.
The specific index it follows is an index no other dividend ETF follows, the Dow Jones Dividend 100 Index. This is an S&P Global index. S&P Global provides us with a methodology document that explains exactly how it chooses stocks and how it modifies its holdings over time. Some of the factors it uses to pick stocks are described in ways that make them confusing to some investors.
The “Stock Universe” From Which SCHD’s Index Selects
Size Matters
The stocks chosen for SCHD are chosen from a total market index, the Dow Jones U.S. Broad Market Index that holds U.S. stocks of all sizes. REITs are excluded. The stocks chosen must have market caps over $500 Million and trade at least $3 Million worth of shares a day.
As we will see, though this size criterion means that SCHD’s index can hold small cap stocks, their impact on SCHD’s dividend yield and its total return will be negligible. This is because SCHD follows a market cap weighted index. Schwab tells us that the “Weighted Average Market Capitalization” of the stocks in SCHD is $138.57 Billion. Thus the “average” stock held by SCHD is more than 70-200 times larger than any small cap stock it might hold.
Consistent Dividend Payment Matters But Not Consistent Dividend Growth
The methodology document explaining how SCHD’s index chooses stocks tells us that the stocks chosen must have a “Minimum 10 consecutive years of dividend payments.” Note, this doesn’t say “growing dividend payments.” To qualify, a stock must simply have paid a dividend every year over the past 10 years.
Stocks Meeting These Preliminary Criteria are Ranked on Four Equally Rated Independent Factors
5 Year Average Dividend Growth
Dividend growth is one of four subsequent factors applied when selecting stocks for this index (and hence SCHD). But the formula used to define dividend growth is easy to misinterpret. The formula used is this:

SPglobal.com
This formula will forgive a year or two of dividend stagnation or even a lowered dividend if the average dividend growth over several of the last 5 years has been very high.
This may explain why SCHD just added EOG Resources (EOG), despite it having only a 4-year history of dividend growth after a 3-year period when dividends were not raised at all.
This formula may also help explain why SCHD has done so well over the past decade compared to ETFs whose algorithms force them to buy stocks of companies with a longer history of consistent annual dividend growth.
That’s because stocks that have had inconsistent dividend growth over a 10-year period but whose dividend growth has picked up strongly over the last few years and may be even stronger going forward will qualify for SCHD. They may be better buys for an investor today than are the stocks of aging companies with stagnant earnings. Those companies typically make tiny annual increases in a stagnant dividend just to maintain their lengthy dividend growth record and keep dividend growth ETFs buying their shares.
Three Other Factors Matter As Much as Dividend Growth
Average dividend growth is only one of four factors S&P Global uses in constructing SCHD’s index. There are three other factors that have equal weight with average dividend growth when the index’s algorithm selects the 100 stocks that go into the index. They are:
• Free cash flow to total debt: This is calculated as annual net cash flow from operating activities divided by total debt. Companies with zero total debt are ranked first.
• Return on equity: This is Annual net income divided by total shareholders’ equity.
• Expected forward yield: Unlike the case with the three earlier factors the index methodology document discusses, the document only lists Expected Forward Yield as a factor but does not give readers any other information as to how this metric is arrived at.
After assigning a ranking for each of these four factors to every stock that made it through the initial screen, the index then adds the four rankings together to create a composite score. The top 100 stocks with the highest composite score are the stocks that get chosen for the index.
Investors need to be aware that these are the only criteria used to select stocks for addition to the Schwab US Dividend Equity ETF. Nothing else about a company comes into the decision to add it to the index. There is no human intervention. The entire process is entirely driven by computer algorithms that embody these criteria.
Once a Stock is Selected, Its Rankings Are Ignored and Market Cap Weighting Takes Over
SCHD’s index is market cap weighted. This is not true of some of its competitors. For example, DGRO’s index, the Morningstar US Dividend Growth Index, weights its stocks using a hybrid method it calls, “a fundamental, dividend-based weighting system.” So DGRO holds more Johnson & Johnson stock than it does Apple stock, though market cap still plays enough of a role in its algorithm that DGRO’s top stocks are all to be found in the market cap weighted S&P 500’s top 20. The SPYD ETF is equal weighted. After each 6 months’ rebalancing, each of SPYD’s 80 holdings is held in the same amount as all the others.
But dividend-related issues play no role in how stocks are weighted in SCHD. Once the top 100 stocks are selected, each stock is held in an amount that is proportional to the size of the stock’s market cap.
SCHD’s index is a specific kind of market cap weighted index, one that is “capped.” That means that when the index is created or rebalanced, the index’s attempts to keep its holdings of any one stock at 4% or below. Though this is the aim, it is worth noting that several weeks after the Dow Jones Dividend 100 Index went through its annual reconstitution, SCHD still holds slightly more than 4% of its top largest holdings.
The index rules also specify that no one GICS sector should represent more than 25% of the value of the whole ETF, though these percentages will be allowed to drift in between rebalancings.
Usually changes in the index’s holdings, and thus in SCHD’s holdings are only made quarterly. The exception to this rule is that if “…the sum of stocks with weights greater than 4.7% exceeds 22%”, the index will not wait for the quarterly rebalancing to make a correction. Instead the ETF will be rebalanced 2 days after that level has been reached.
What this means in practice is that four individual stocks in the index that have the largest market caps could make up as much as 5% of the value of the index without triggering any changes. If those are healthy stocks growing their earnings strongly and paying good dividends, SCHD investors prosper. If they aren’t, they won’t.
As of March 29, 2022 the top 10 stocks in SCHD made up 40% of its total value. This makes it extremely important for investors to take a very close look at those top 10 stocks.
Once Added to the Index, Stocks Stay In Even If Not Ranking Highly on The 4 Selection Parameters
Another extremely important issue disclosed in the small print describing how SCHD’s index is rebalanced is this: During the annual review of SCHD’s holdings, the following rule applies:
The constituent stocks will remain in the index as long as they are among the top 200 rankings by the composite score.
So while a stock must be in the top 100 to get into the index, it will stay in the index even if it drops a full 100 positions when ranked by the composite score made up of the four criteria listed earlier. Only a failure to pay a dividend will get it thrown out until that ranking drops.
This explains why SCHD still holds quite a few stocks whose inclusion investors question, including some that make up a significant amount of its total weight. It also means that going into a very different environment than the extremely low interest rate environment that has prevailed since SCHD first started trading on 10/20/2011, SCHD may end up holding a lot of stocks that meet its criteria but are not ideal investments for a higher rate world.
What’s Missing from SCHD’s Algorithm? Valuation!
P/E Ratio
Stocks that play a major role in the index can be trading–and currently are trading–at prices that give them P/E ratios far above their historical average P/E ratios.
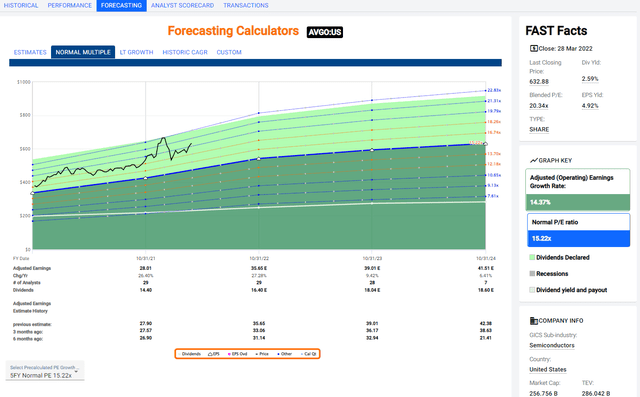
Broadcom (AVGO) is among the Top 10 stocks by weight in SCHD. Below you can see how much higher than its P/E ratio is than its 5-year average and how future earnings are not expected to be growing at a rate to support that current P/E ratio.
AVGO’s 5-Yr. Avg. P/E Compared To Current P/E and Forecast Earnings
fastgraphs.com
Earnings Growth Rate
The selection criteria don’t directly consider how a company’s expected future earnings growth rate compares to its current and/or past earnings growth rates.
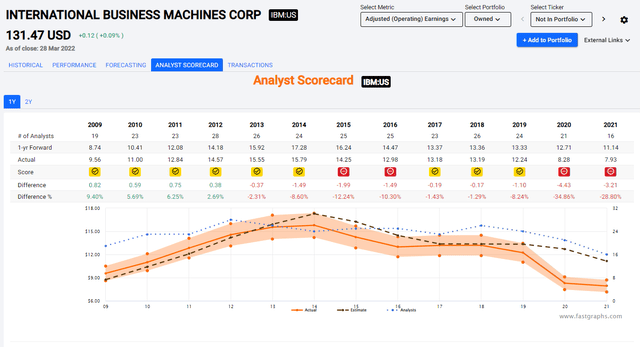
As of March 29, 2022, IBM was again in the Top 10 of SCHD’s holdings when ranked by weight. It has seen its earnings decrease by -9.39% over the past decade. Estimates currently forecast that it will resume growing its earnings. But how many times has IBM failed to meet analysts’ expectations? Every year since 2013, according to FAST Graphs’ Analyst Scorecard.
Analysts’ Forecasts for IBM Matched With Actual Reported Earnings
fastgraphs.com
Sales Trends
Sales trends and the valuation metrics that describe how the company’s sales are performing are also not used to evaluate the stocks included in SCHD.
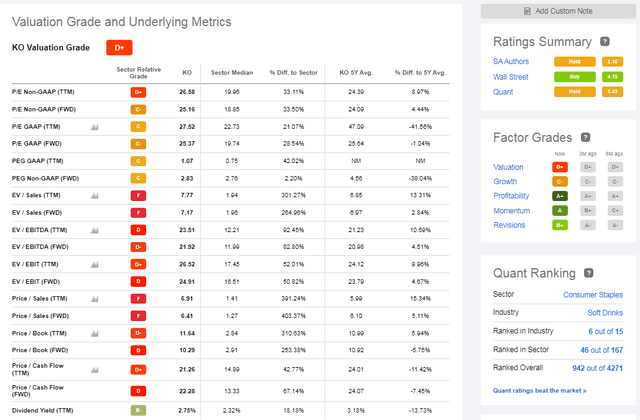
Coca-Cola (KO) is among the very largest holdings in SCHD. This is what its valuation looks like according to Seeking Alpha’s Quant feature. Note the “F”s in the Sales-related categories.
Seeking Alpha
FactSet data as reported by Fastgraphs.com tells us that Coca-Cola’s earnings growth rate over the past 5 years is only 5.81%. It is not expected to grow its earnings by more than 6 or 7% going forward. And those estimates are probably overly optimistic. Even so, it is trading at a price right now that gives it a P/E ratio of 26.34.
Do you really want to be paying that much for a piece of Coca-Cola’s 2.84% dividend?
Now that we have looked at how the stocks in SCHD are chosen, it is time to think about how those stocks, many of which have very high valuations and slow earnings growth rates, may perform in an inflationary environment that is characterized by rising interest rates. And that means we need to zero in on the interest rates that SCHD’s component stocks and the ETF itself is paying.
Some of SCHD’s Stocks’ Modest Dividend Yields Are Already Not Competitive with Safe Treasury Notes
Below you can see some dividend and valuation metrics for the 10 largest stocks held in SCHD. These stocks together make up 40% of the ETFs total value.
Valuation Metrics for the Top 10 Stocks in SCHD as of 3/29/2022

FactSet data reported by fastgraphs.com – Table by the author
Note how the dividend yields of most of these stocks barely reach 3%. The sole exception is IBM, a company that has been steadily destroying shareholder value since 2013 and now has no way of attracting investors except to offer them an outsized dividend.
Shorter Treasury Rates Have Become Competitive
For most of its brief life as an ETF, SCHD has not had to worry about Treasury rates because they have been near zero. I suggested that safe fixed rates might reach 2% in an article I published back in November last year. I got a lot of pushback from readers who thought I was dreaming that safe fixed income rates would reach 2% any time soon. But all that changed once inflation showed that it was quite capable of remaining above 7% for months. It is still showing no signs of slowing down.
I just bought a 2-year Treasury Note at auction this week, whose 2.365% yield is giving me more income than I would get where I to buy Home Depot (HD), Texas Instruments (TXN), or Merck (MRK) stock today. That yield matches Broadcom’s (AVGO) yield. At market close on March 29, 2022, you could have bought a 3-year Treasury Note yielding 2.553%, which is not even 2 basis points less than what PepsiCo (PEP) is yielding.
There is no question that I will get back the money I put into that bond in 24 months. If the market crashes and takes five years to recover, I still get all my principal back. Ditto if companies’ earning ability is harmed by yet another unexpected catastrophe–or even if it is harmed by an expected one like inflation eroding customers’ buying power and sending sales lower.
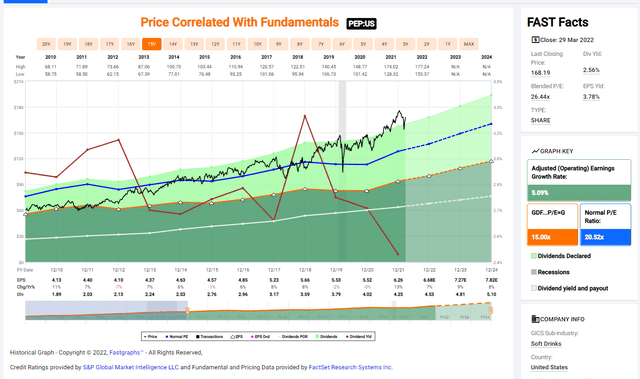
Getting back to PepsiCo, it’s worth noting that the reason its dividend yield is not tempting right now compared to safe fixed income is because PepsiCo’s inflated price has lowered its yield below what it has been historically. That’s because its price has surged dramatically over the past few years rising 68% since its low in 2018. Meanwhile, its dividend has only been growing modestly–5-6% a year since the beginning of 2019.
The brown line in the FAST Graph below shows you the history of PepsiCo’s yield, which you can clearly see has deteriorated as its price has risen well above a level giving it a P/E ratio corresponding to its earnings growth rate.
Pepsi Price, Earnings and Dividend History
fastgraphs.com
If 2 or 3-year Treasury yields were to rise just half a percent more to 3%, they would become competitive with the yields of Cisco Systems (CSCO), Pfizer (PFE), Coca-Cola, and Amgen (AMGN).
SCHD’s Yield Is Barely Competitive Now
Schwab tells us that SCHD’s yield over the past 12 months has been 2.92% but that yield is based on its share price on February 28, 2022, back when it was selling for $77.10 a share. That old price is 3.69% lower than its price on March 29, 2022 when it closed at $80.06. It is hard to be sure exactly what its actual yield is currently, but the evidence is that is lower.
Reported Dividend Yields Come with Asterisks
This points out something that ETF investors who invest for income need to become more aware of. You have to be very careful when interpreting the stated past and expected future yields of an ETF. The fund company will do what it can to make it look higher. That is possibly why Schwab reports the SCHD’s dividend with numbers dated a month ago, even though most of the other statistics it reports are taken from the most recent market close.
SCHD’s Forward Yield is Not Impressive
Seeking Alpha’s Dividend feature gives us a lower number for SCHD’s trailing 12 months: 2.83%. It also gives us a lower estimated future yield than does Schwab. Seeking Alpha reports that SCHD’s forward dividend yield as of March 30, 2022 was only 2.59%. I’m not sure how that figure is computed, but I notice as I write this that, that yield figure it dropped a couple of basis points from what was listed on March 29, 2022. So it looks like it is based on the last closing price.
If indeed SCHD is only paying 2.59%, it may no longer remain competitive with what you can get from the 3-yr Treasury bond on a day when bond rates are rising.
The threat is real: the rationale for using dividend stocks for income is weakening as rates begin their rise back to something approaching a normal level. And we haven’t even begun to discuss what happens in the short term to the prices of the stocks in SCHD if rates rise to levels that might protect you from 8% inflation!
SCHD May Still Have Some Advantages in Comparison to Safer Fixed Income
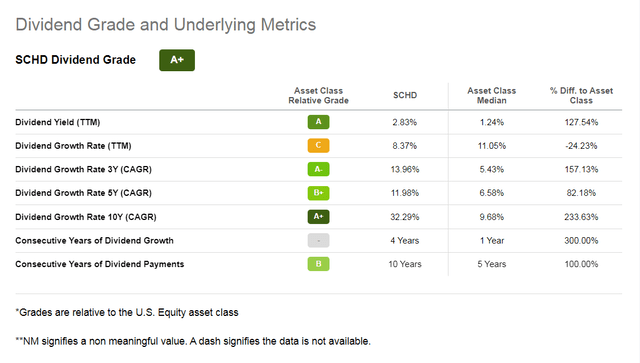
To be fair, there are still some reasons to invest in The Schwab US Dividend Equity ETF. Seeking Alpha’s Quant Scoring feature still rates SCHD as a buy as you can see from the graphic below.
Seeking Alpha
Note, however, that the Seeking Alpha Quant Rankings are a backward-looking grading scheme which is using the trailing 12-month dividend yield, not the current 2.59% forward yield that Seeking Alpha reports on the SCHD Summary Page.
Note also that the Quant Rating does not rate SCHD’s trailing dividend growth rate highly, awarding it just a C grade. This is important, because dividend growth is the feature of dividend stocks that dividend investors often cite as being why they are superior to fixed income alternatives.
Dividend Growth Could Make SCHD More Appealing
If SCHD’s stocks were to keep growing their dividends enough that SCHD continued to have the 8.37% dividend growth rate it maintained over the past 12 months when it has paid out $2.26/share, its payout in 12 months would grow to $2.45/share. For a buyer who bought SCHD at March 29, 2022’s close, that would represent a 3.06% dividend yield, which is very close to the 3.05% SEC yield Schwab reports for its ETF which is dated March 28, 2022. That yield would still be better than that of the current 3-year Treasury Note.
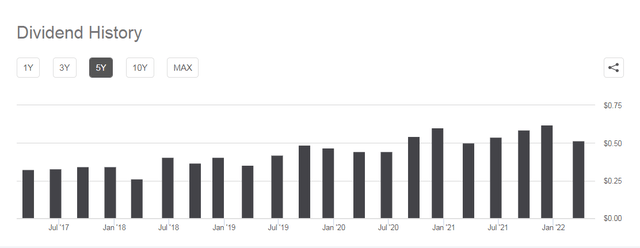
However, we have no way of knowing if SCHD will in fact see that large of a dividend raise this year. As you can see, its dividend payment history is not smooth the way the history of a single dividend paying stock often is.
SCHD’s 5-Year Quarterly Dividend Payment History
Seeking Alpha
With inflation raising the costs of raw materials and manufacturing, dividend-paying companies can only raise prices so much before they risk driving away consumers. Only Financials are believed to benefit from higher rates. They do play a large role in SCHD, though it is hard to know exactly how big that role is now since the data Schwab gives us for SCHD’s sector breakdown dates back to December 31, 2021. At that time Financial stocks made up 21.47% of SCHD’s total value.
Still it looks like, for now, dividend growth may provide the buffer needed to keep SCHD competitive. And of course, for investors who invested in SCHD a few years ago, their yield on cost is still quite excellent. But if you are thinking of investing new money into SCHD as 2022 goes on, you might want to take a good look at fixed income rates before you do and see how they compare with SCHD’s yield at the time you are going to buy in.
Favorable Dividend Taxation May Give SCHD an Advantage in a Taxable Account
The one advantage dividend stocks may have over fixed income is that fixed income interest is taxed at ordinary income rates while qualified stock dividends–the kind of dividends SCHD pays out–are either not taxed at all if you are not earning enough to be in the 22% tax bracket or are taxed at only 15% until you reach the 35% tax bracket.
Bottom Line: SCHD Is A Strong Hold For Current Owners. New Money Benefits from Waiting
There is no reason to sell your SCHD holding now. As the year progresses, if the market corrects some more and SCHD’s share price starts to approach what you paid for your shares, it might be wise to take profits. That is especially true if the reason SCHD’s price is declining is because dividend investing is losing its luster in the face of stronger competition from safer fixed income alternatives.
Those looking to invest new money in SCHD should be cautious. They may be rewarded for patience if they wait to invest in SCHD after market forces have pushed down the prices of the many high quality but also highly valued dividend stocks it currently holds. If SCHD’s constituent stocks’ prices drop to a level that provides a better margin of safety for investors, SCHD’s yield will also rise to where it is more competitive with safer fixed income alternatives.
[ad_2]
Source links Google News

