[ad_1]

omersukrugoksu/iStock via Getty Images
(This article was co-produced with Hoya Capital Real Estate)
Introduction
To be sensitive to the war in Ukraine, I reworded Baron Rothschild’s, of the famous banking dynasty, famous investing quote of when to buy: “When there is turmoil in the streets.” In other words, when everyone else is selling. Most of Europe, investment-wise, is divided into two parts. The western part being Developed Markets; the eastern, old Warsaw Pact countries, classified as Emerging/Frontier Markets. The current elevated risk line parallels that divide closely at this time in history.
The Vanguard FTSE Europe ETF (NYSEARCA:VGK) only invests in the countries that FTSE classifies as Developed. The Index used by VGK consists of the following 16 developed countries: Austria, Belgium, Denmark, Finland, France, Germany, Greece, Ireland, Italy, Netherlands, Norway, Poland, Portugal, Spain, Sweden, Switzerland, and the United Kingdom. Greece is why the Index matters, as MSCI downgraded Greece to Emerging Market status back when Greece required the European Union to rescue the country financially. MSCI also still considered Poland as Emerging.
Investing outside your home currency will add currency-movement risk to your investment. For investors wanting Developed Market Europe exposure without that risk, there is the X-trackers MSCI Europe Hedged Equity ETF (NYSEARCA:DBEU) option, which is also covered here.
Why Europe now?
While investors should always consider worldwide equity exposure, is Europe a good place to be increasing to one’s exposure? Here are some reasons why this is a good time:
- I believe Baron Rothschild would be an investor at this time due to the pessimistic view of many because of the situation in Ukraine and its unknown outcome. While SPY has bounced back to pre-invasion levels, the VGK ETF is still down over 4%.
- Except for a small allocation to Poland in VGK, neither of the ETFs covered here are exposed to any Eastern European stocks, which should lower the investment risk.
- With the Fed, but not ECB raising interest rates, the USD should strengthen against the major European currencies. This should help European exporters by making their goods more competitive against USD exports.
- According to Goldman Sachs, historically, European equities have delivered positive returns when the Fed hikes rates. The MSCI, Europe’s high concentration of cyclical sectors, leads us to believe these indices may do well in this environment.
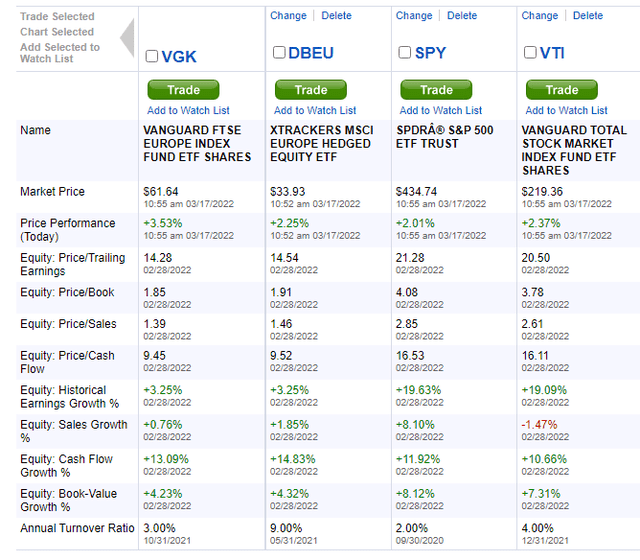
- When comparing equity ratios between Europe-focused and US-focused ETFs, the values are clearly in Europe’s favor. With the Fed trying to fight inflation by slowing the US economy, that could make US values seem even more extreme. Currently, corporate earnings expectations are rising faster in Europe than in the US.
- Investors around the world become increasingly aware of the importance of incorporating ESG issues into investment decisions, European companies generally lead in the ESG rankings and the region is well-positioned to benefit from fund flows as this trend continues upward.
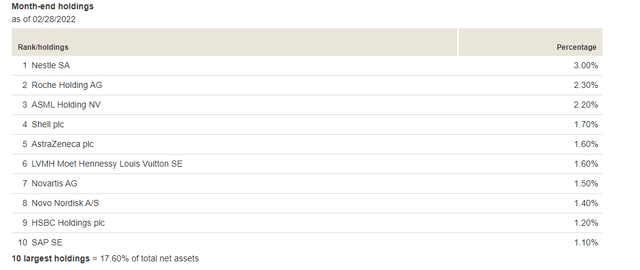
- Europe-focused ETFs don’t depend on a few Mega stocks for their performance. The largest allocation in VGK is 3%, whereas the SPDR S&P 500 Trust ETF (SPY) has 3 holdings greater than 3%. SPY’s Top 10 accounts for 29% of its holdings versus only 17% for VGK.
Understanding the Vanguard FTSE Europe ETF
Seeking Alpha describes this ETF as:
Vanguard FTSE Europe ETF is an exchange traded fund launched and managed by The Vanguard Group, Inc. It invests in public equity markets of European Developed region. It invests in stocks of companies operating across diversified sectors. It invests in growth and value stocks of companies across diversified market capitalization. It seeks to track the performance of the FTSE Developed Europe All Cap Index. VGK started in 1990.
Source: Seeking Alpha
VGK has $21b in assets and provides investors with a 3.5% yield. Vanguard charges 8bps in fees, very reasonable for an ETF holding international stocks.
Examining the Index used
FTSE describes their Index as:
The FTSE Developed Europe All Cap Index is a market-capitalization weighted index representing the performance of large, mid and small cap companies in Developed European markets, including the UK. The index is derived from the FTSE Global Equity Index Series (GEIS), which covers over 7,400 securities in 47 different countries and captures 98% of the world’s investable market capitalization.
Source: research.ftserussell.com Index
Basic information on the Index includes:
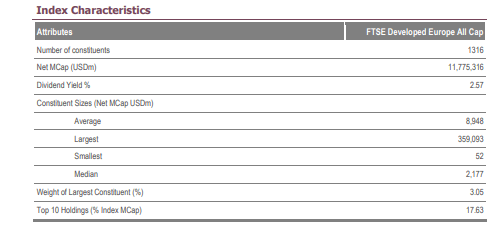
FTSE Russell
I did not find a specific Methodology PDF for this index, but they have one that explains the FTSE index series it is a part of: Index Methodology PDF
VGK Holdings review
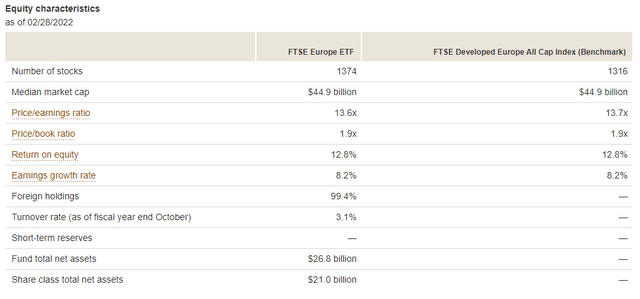
Vanguard
Morningstar has more statistical data:
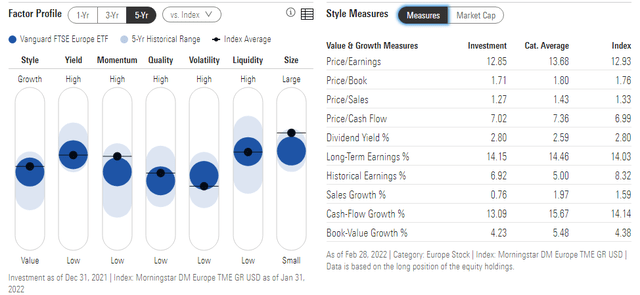
Morningstar
The VGK ETF, on the various factor scales, basically is in the middle, which isn’t surprising for a broad-based-index ETF. While earnings growth is respectable, sales growth is anemic. The market cap allocations run smaller than the Index with VGK average MC at $39b versus the Index’s $54b. VGK underweights the largest stocks and overweights Mid- and Small-Cap stocks.
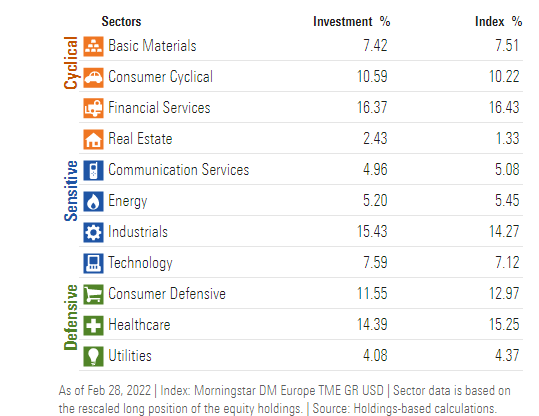
Morningstar
VGK varies by 1% from the Index in several sectors but not be enough to really affect its performance via the Index. Financials, Industrials, and Healthcare are the Top 3 sectors, accounting for 46% of the portfolio. Pharmaceuticals, Banks, and Insurance companies are the top industry exposures, all with 5-10% exposures.
Data from multiple sources: compiled by Author
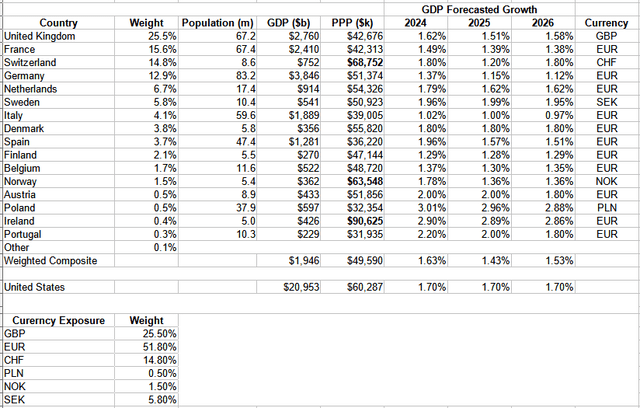
Using data from www.theglobaleconomy.com, I added basic country data, plus IMF GDP growth forecast for 2024-26. I included the United States for comparison purposes. While the average Purchasing Power Parity, labeled “PPP”, is below the USA for the ETF, three countries are higher.
Since I did not see that VGK does any currency hedging, I listed the currency exposure levels the ETF has. How the USD moves against these currencies, especially the Euro and the British Pound, will affect the ETF’s return to US investors and differently for overseas investors.
Top 10 holdings
Vanguard
Well-known, Large-Cap stocks dominate the list as expected, so much so that the Top 10 are almost 18% of the assets, despite VGK holding over 1360 stocks. The full holdings list indeed shows no currency-hedging assets.
VGK Distribution review

Seeking Alpha
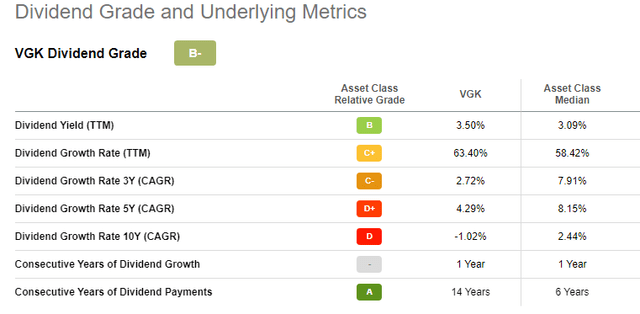
Over the past decade, a pattern of an extra-large payout at year-end has developed. Unfortunately, the yearly amounts paid are not growing. Seeking Alpha provides a dividend scorecard for ETFs and gives VGK a “B”, apparently on the strength of their yield and consecutive payment record.
Seeking Alpha
Understanding the X-trackers MSCI Europe Hedged Equity ETF
Seeking Alpha describes this ETF as:
X-trackers MSCI Europe Hedged Equity ETF is managed by DBX Advisors LLC. The fund invests in public equity markets of European Developed region. It invests directly and through derivatives in stocks of companies operating across diversified sectors. The fund uses derivatives such as forwards to create its portfolio. It invests in growth and value stocks of companies across diversified market capitalization. It seeks to track the performance of the MSCI Europe US Dollar Hedged Index. DBEU started in 2013.
Source: Seeking Alpha
DBEU holds $525m in assets with a .8% yield. The managers charge 45bps in fees. MSCI describes their Index as:
The MSCI Europe US Dollar Hedged Index represents a close estimation of the performance that can be achieved by hedging the currency exposures of its parent index, the MSCI Europe Index, to the USD, the “home” currency for the hedged index. The index is 100% hedged to the USD by selling each foreign currency forward at the one-month Forward weight. The parent index is composed of large and mid cap stocks across 15 Developed Markets countries and its local performance is calculated in 6 different currencies, including the Euro.
Source: MSCI
This again points out a concern about mixing index providers. The one country difference between VGK and DBEU is Poland, which MSCI, as I mentioned, still classifies as Emerging Market and thus not included in this index. Since Poland is only .5% of VGK, that is a minor difference and removes one currency needing hedging.
DBEU Holdings review
Morningstar
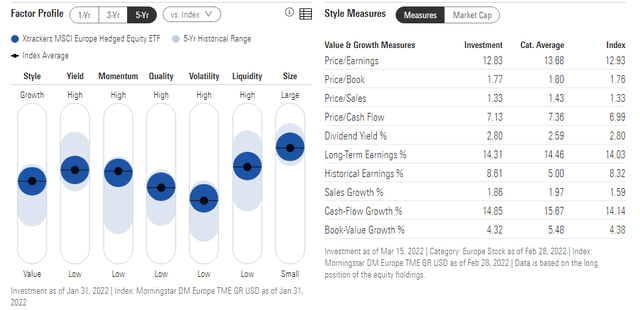
DBEU ETF shows more variation in the Factors than VGK does, with DBEU holding more Large-Cap assets than VGK does and has no Small-Cap exposure. Style measures for both ETFs are close and should not drive performance.
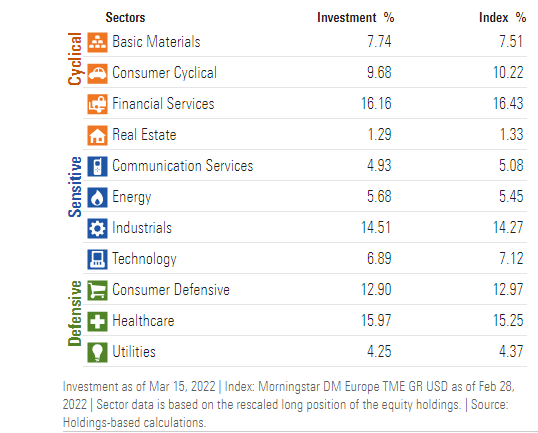
Morningstar
I will compare sector weights later but the order matches well against VGK.
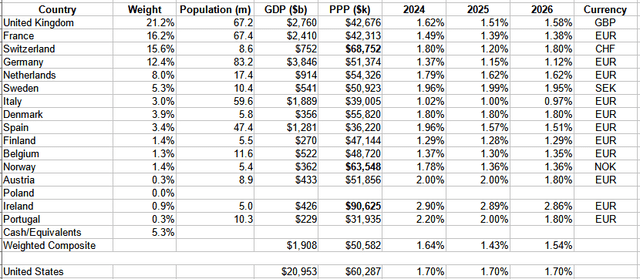
Data from multiple sources: compiled by Author
The weighted composite results for all the columns mirror VGK very closely, not enough difference to be a deciding factor.
Top 15 holdings

etf.dws.com
The Top 10 stocks are about 20% of the portfolio; the Top 15, 25%. This is slightly more concentrated than VGK. One big difference between the two ETFs is the asset count, with DBEU holding under 500 versus VGK over 1300. This helps explain why DBEU’s market cap is bigger.
DBEU Distribution review

Seeking Alpha
Here we see a policy difference as DBEU uses a semi-annual distribution policy, versus quarterly for VGK. Again, there is no payout growth.
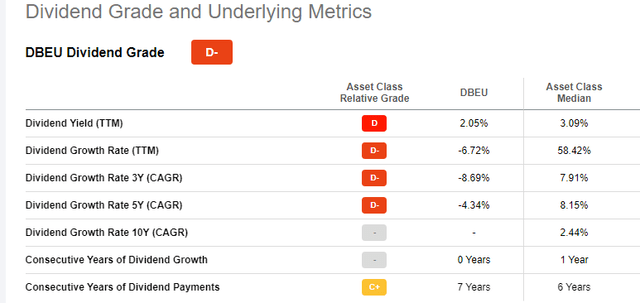
Seeking Alpha
That scorecard is definitely not the one any income investor would care to have.
Comparing Performance
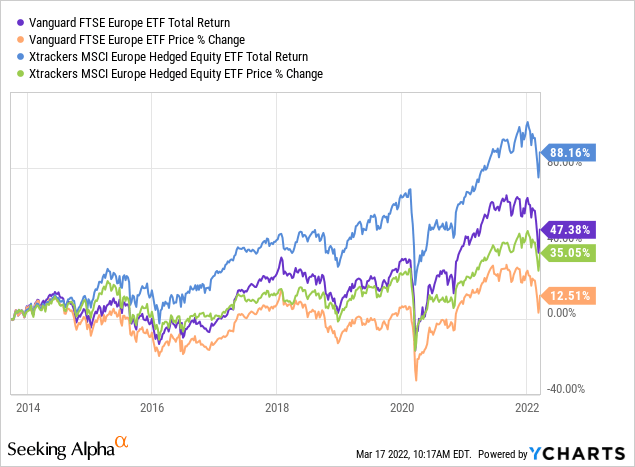
Since the DBEU ETF started in October 2013, hedging has been the better strategy. Here is how the USD has performed versus the GBP and EUR over that time period:
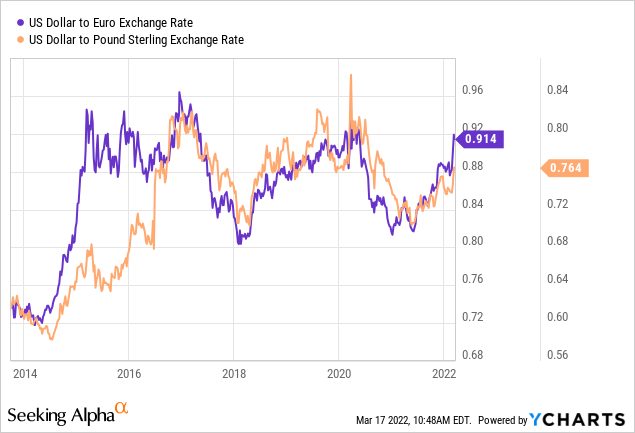
Rising lines indicate the USD was gaining strength against that currency, which hasn’t been true all the time since late 2013. I ran the next set of charts to see how well the ETF prices correlated to the Euro’s movement.
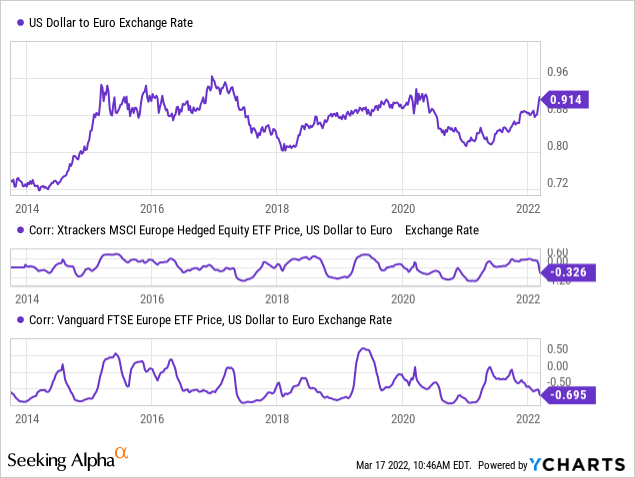
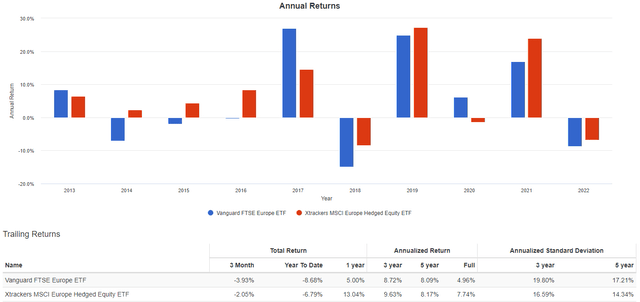
Both show a negative correlation but as expected, DBEU has a closer correlation than does VGK. Using Portfolio Visualizer, we can see annual returns and how they varied.
Portfolio Visualizer
Portfolio Strategy
From the above chart, there were years where the returns for both ETFs were close, but those years appear to be the exceptions. Since lagging poorly in 2017, DBEU has been the better annual performer since but once. With the Fed having just increased the rate they control (and indicating many more to come), and the Central banks in Europe being less aggressive, a stronger dollar seems to be highly likely, especially if the war drags on.
While Europe is in turmoil at the moment, its stocks show more value than US stocks, as can be seen in the next comparison.
Fidelity
As the next table shows, these two ETFs just scratch the surface of the ETFs, let alone CEFs and MFs that have Europe investment strategies to review.

Hoya Capital Income Builder
Source: Hoya Capital Income Builder Market Place
For investors looking for wider International equity exposure and another set of unhedged/hedged ETFs, you might want to read IHDG Vs. IQDG: To Hedge Or Not Your International Dividend ETF.
[ad_2]
Source links Google News

