[ad_1]

SlobodanMiljevic/E+ via Getty Images
Introduction to VanEck Steel ETF (NYSEARCA:SLX)
Inflation is a major concern to consumers, policy makers, and investors. As I have written previously, inflation-sensitive stocks, including those in the metals and mining industry, are particularly good at hedging changes in inflationary expectations. In the latest update of our sector and industry ETF return forecasts, the expected return for one of these inflation-sensitive ETFs floated to the top: VanEck Steel ETF (SLX).
This capitalization-weighted ETF includes the top 25 steel companies around the globe. It is a passively-managed ETF that tracks the NYSE ARCA Steel Index (STEEL). The index includes not only steel manufacturers, but also companies that service and supply them. Here is a list of the top 10 constituents:
| Top 10 Holdings | ||||
| as of 02/28/22 | ||||
|
Name |
Ticker |
% | ||
| VALE SA |
VALE US |
16.68 | ||
| RIO TINTO PLC |
RIO US |
15.27 | ||
| NUCOR CORP |
NUE US |
8.11 | ||
| ARCELORMITTAL SA |
MT US |
6.56 | ||
| TENARIS SA |
TS US |
5.06 | ||
| RELIANCE STEEL & ALUMINUM CO |
RS US |
4.73 | ||
| UNITED STATES STEEL CORP |
X US |
4.66 | ||
| POSCO |
PKX US |
4.46 | ||
| STEEL DYNAMICS INC |
STLD US |
4.45 | ||
| CIA SIDERURGICA NACIONAL SA |
SID US |
4.34 | ||
| Top 10 Total (%) | 74.3 | |||
Steel is a global industry, and many of these companies have locations all around the world. By location of their corporate headquarters, the country weightings break down as follows:
| Country Weightings (%) | |||
| as of 02/28/22 | |||
| Country | % | ||
| United States | 40.03 | ||
| Brazil | 24.83 | ||
| Australia | 15.27 | ||
| Netherlands | 8.72 | ||
| Luxembourg | 6.56 | ||
| South Korea | 4.46 | ||
| China | 0.19 | ||
| Other/Cash | -0.06 | ||
| 100 | |||
SLX has very attractive value characteristics, as shown below. It has a reasonable expense ratio, and decent liquidity as measured by bid-ask spread. The weighted average market cap of its constituents is in the mid-cap range.
| Key Characteristics: | |||
| as of 02/28/22 | |||
| Total Net Assets ($M) | 115.59 | ||
| Net Expense Ratio | 0.56% | ||
| Average Bid-Ask Spread | 0.08% | ||
| Price/Earnings Ratio | 4.00 | ||
| Price/Book Ratio | 1.41 | ||
| 30-Day SEC Yield | 5.11% | ||
| Weighted Avg. Mkt. Cap. ($M) | 39,347 | ||
Why SLX is Attractive: Factor Analysis
We base our selection of ETFs on factor analysis. A “factor” is a mathematical way of measuring how much of a certain characteristic a security has. For example, a stock’s size is typically measured using market capitalization. A stock’s value might be measured with its price/earnings ratio. Its quality might be measured with its debt/equity ratio.
A previous article pointed out that some of the same factors (characteristics or attributes) that published academic research has found to be helpful in selecting individual stocks can be helpful in selecting sectors and industries. These factors can be grouped into the following categories:
- Value
- Momentum
- Quality
- Sentiment
In this article we will focus on the most predictive factor in each of these four factor categories. We will illustrate each factor’s power in forecasting residual return (return not related to risk factor exposures, such as market beta) among sector and industry ETFs. (we use a proprietary risk model to separate out risk-related return from risk-adjusted return.) We will show that SLX is heavily exposed to each of these four powerful factors, resulting in a very high overall return forecast.
Value Factor: EBIT/EV
EBIT is earnings before interest and taxes (EBIT). We divide EBIT by enterprise value (EV), which includes the market value of equity and the book value of debt. This value ratio is one that a private equity investor looking to purchase a whole company might use.
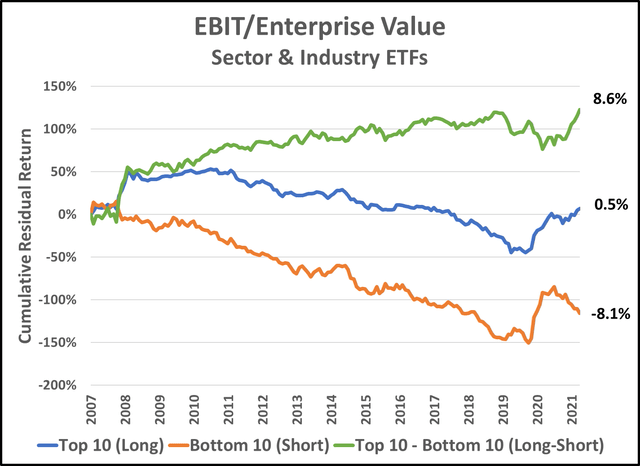
Our research indicates that within the sector and industry ETF universe, EBIT/EV is the most powerful value factor. The graph below illustrates one of our research tests for that factor. We begin our test at the beginning of 2007 when the number of ETFs with data for this factor reached a critical mass of 41. (Currently, of the 90 ETFs in our universe, 87 have data for this factor.) At the end of each month, we form a “Top 10” portfolio of the 10 ETFs with the highest EBIT/EV. Each has a 10% weight. We calculate the residual (risk-adjusted) return of this portfolio during the month and then re-select and rebalance the “Top 10” portfolio at the end of the next month, and so on. Similarly, at the end of each month we also form a “Bottom 10” portfolio of the 10 ETFs with the smallest, or most negative, EBIT/EV, re-selecting and rebalancing monthly.
Source: Graph created by author using data from FactSet
In the graph above, the blue line is the cumulative log of residual return of an equal-weighted portfolio of the 10 ETFs with the highest EBIT/EV, rebalanced monthly. Since 2007, the average log of residual return (net of risk effects such as equity market and interest rate betas) has been .5% per year on average. The orange line is the same thing but investing in the 10 with the lowest (or most negative) EBIT/EV. That return has been -8.1%. The green line is a long-short implementation of the strategy. Its return has been 8.6% per year.
It is critical to note that we are measuring cumulative residual return, not cumulative total return. The distinction is vital. The vast majority of return for sector and industry ETFs is systematic return, most especially return derived from an ETF’s market beta or sensitivity to the market. Residual return is the return that is left unexplained by an ETF’s systematic risk factor sensitivities. Over the long-term, the weighted average residual return for all of the ETFs in the sector and industry universe is zero! That’s right. There is no alpha on average. Overall, over the long term, ETFs earn return only from their systematic risk sensitivities, especially their sensitivity to the market (or market beta). However, certain factors, such as EBIT/EV, help to explain risk-adjusted return. These are the factors that interest us.
Source: Graph created by author using data from FactSet
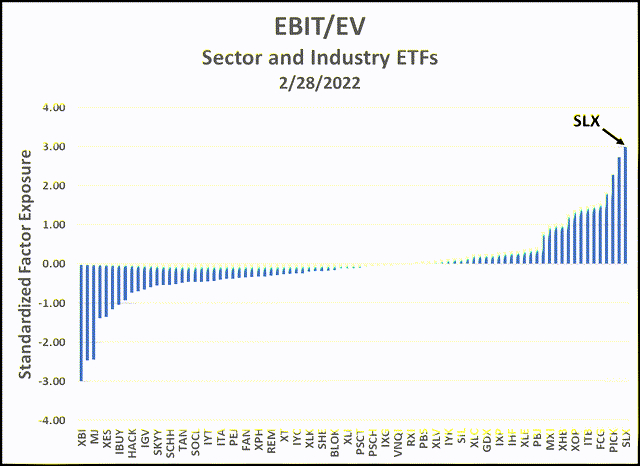
As of February 28, 2022, VanEck Steel ETF (SLX) had a standardized factor exposure to EBIT/EV of 3.00, meaning that it was three standard deviations above the universe mean. That was the highest factor exposure of any sector or industry ETF in our universe.
Momentum Factor: 12-Month Exp Wtd Residual Return
Most published work on momentum uses return over the prior twelve months as the basis for the calculation. When defining momentum for individual stocks, the last month is omitted because of the strong tendency for stocks to experience short-term reversal. However, when dealing with sectors and industries, we include the last month because there is no evidence of short-term reversal.
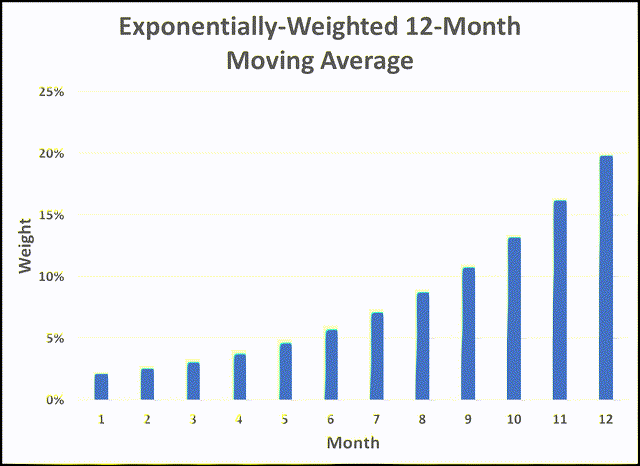
Returns for various trailing time periods may be used to capture momentum effects-3,6,9, and 12 months have all been used, although 12-month trailing return is by far the most common. Our preferred methodology is to use the exponentially-weighted 12-month moving average (shown below), rather than an equal-weighted 12-month moving average.
Source: Graph created by author
The other important twist that we apply to measuring ETF return momentum is to use residual returns rather than total returns as the basis for the factor. Since we are attempting to forecast residual returns, it makes sense to use trailing residual return to build our factor.
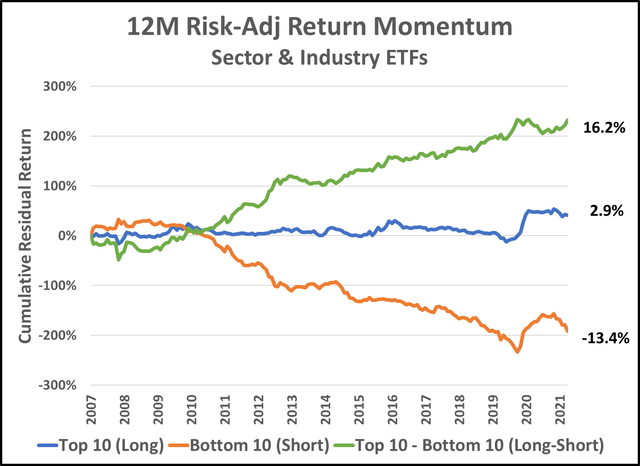
Our research indicates that within the sector and industry ETF universe, 12-month residual return (12M RR) is the most powerful momentum factor. The graph below illustrates one of our research tests for that factor. We begin our test at the beginning of 2007 when the number of ETFs with data for this factor reached a critical mass of 48. (Currently, of the 90 ETFs in our universe, 89 have data for this factor.) At the end of each month, we form a “Top 10” portfolio of the 10 ETFs with the highest 12M RR. Each has a 10% weight. We calculate the residual (risk-adjusted) return of this portfolio during the month and then re-select and rebalance the “Top 10” portfolio at the end of the next month, and so on. Similarly, at the end of each month we also form a “Bottom 10” portfolio of the 10 ETFs with the smallest, or most negative, 12M RR, re-selecting and rebalancing monthly.
Source: Graph created by author using data from FactSet
In the graph above, the blue line is the cumulative log of residual return of an equal-weighted portfolio of the 10 ETFs with the highest 12M RR, rebalanced monthly. Since 2007, the average log of residual return (net of risk effects such as equity market and interest rate betas) has been 2.9% per year on average. The orange line is the same thing but investing in the 10 with the lowest (or most negative) 12M RR. That return has been -13.4%. The green line is a long-short implementation of the strategy. Its return has been 16.2% per year.
Again, please note that we are measuring cumulative residual return, not cumulative total return.
Source: Graph created by author using data from FactSet
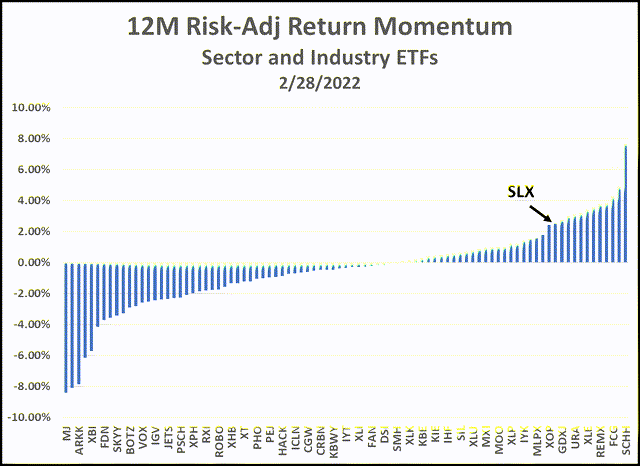
As of February 28, 2022, VanEck Steel ETF (SLX) had a 12-month residual return of 2.53%, which was among the top 12 ETFs in the sector and industry ETF universe. It is unusual for the same security to have attractive value and momentum characteristics, but SLX had a meaningful exposure to both.
Quality Factor: ROIC
Return on invested capital (ROIC) is a measure of how profitable a company is. ROIC is net income divided by invested capital, which consists of the book value of both debt and equity. It differs from ROE (return on equity) in that both debt and equity are included in the denominator, so a company that uses debt instead of equity as a source of capital is not rewarded.
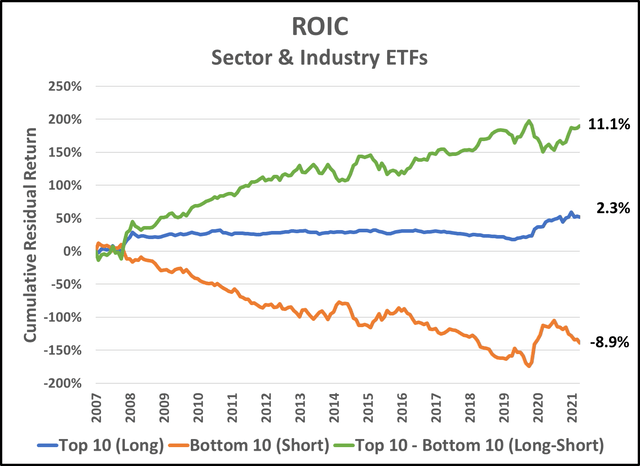
Our research indicates that within the sector and industry ETF universe, return on invested capital (ROIC) is the most powerful quality factor. The graph below illustrates one of our research tests for that factor. We begin our test at the beginning of 2007 when the number of ETFs with data for this factor reached a critical mass of 42. (Currently, of the 90 ETFs in our universe, 88 have data for this factor.) At the end of each month, we form a “Top 10” portfolio of the 10 ETFs with the highest ROIC. Each has a 10% weight. We calculate the residual (risk-adjusted) return of this portfolio during the month and then re-select and rebalance the “Top 10” portfolio at the end of the next month, and so on. Similarly, at the end of each month we also form a “Bottom 10” portfolio of the 10 ETFs with the smallest, or most negative, ROIC, re-selecting and rebalancing monthly.
Source: Graph created by author using data from FactSet
In the graph above, the blue line is the cumulative log of residual return of an equal-weighted portfolio of the 10 ETFs with the highest ROIC, rebalanced monthly. Since 2007, the average log of residual return (net of risk effects such as equity market and interest rate betas) has been 2.3% per year on average. The orange line is the same thing but investing in the 10 with the lowest (or most negative) ROIC. That return has been -8.9%. The green line is a long-short implementation of the strategy. Its return has been 11.1% per year.
Again, please note that we are measuring cumulative residual return, not cumulative total return.
Source: Graph created by author using data from FactSet
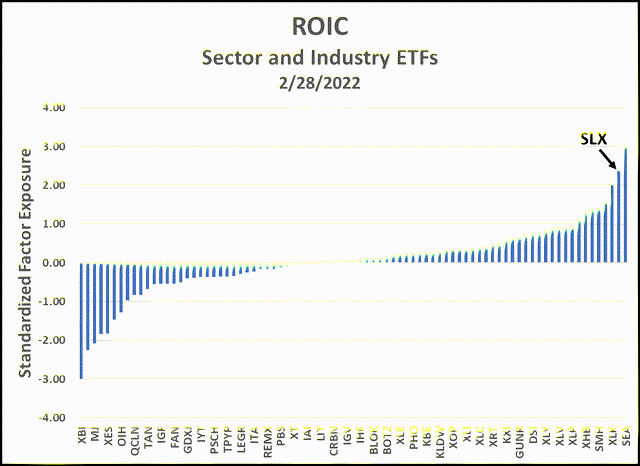
As of February 28, 2022, VanEck Steel ETF (SLX) had a standardized factor exposure to ROIC of 2.36, meaning that it was 2.36 standard deviations above the universe mean. This factor exposure was the second-highest of all sector and industry ETFs.
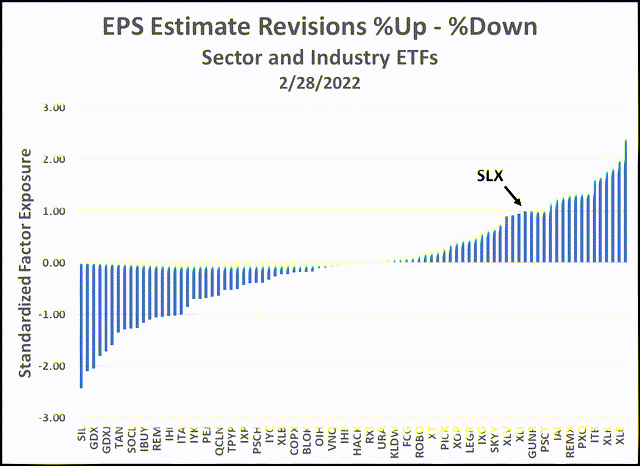
Sentiment Factor: EPS Estimate Revision Diffusion
The changes that analysts make in their forecast of future EPS has been shown to be a powerful predictor of future relative performance for stocks for many years. “Diffusion” is calculated as (#up – #down) / (#up + #down), which is a way of calculating %up-%down. “# up” means the number of upward analyst revisions of EPS in the last month. We use a fairly complex way of incorporating changes in the EPS forecasts that analysts make for the underlying constituents of an ETF, combining data for the next two fiscal years.
Because it is based on changes in the estimate of future earnings, EPS Estimate Revision Diffusion tends to be the most forward-looking factor, providing an early warning if the outlook for a sector or industry is changing.
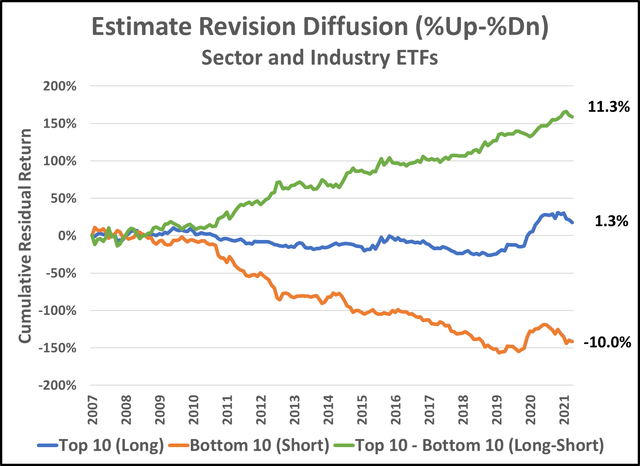
Our research indicates that within the sector and industry ETF universe, EPS Estimate Revision Diffusion is the most powerful sentiment factor. The graph below illustrates one of our research tests for that factor. We begin our test at the beginning of 2007 when the number of ETFs with data for this factor reached a critical mass of 42. (Currently, of the 90 ETFs in our universe, 88 have data for this factor.) At the end of each month, we form a “Top 10” portfolio of the 10 ETFs with the highest Estimate Revision Diffusion. Each has a 10% weight. We calculate the residual (risk-adjusted) return of this portfolio during the month and then re-select and rebalance the “Top 10” portfolio at the end of the next month, and so on. Similarly, at the end of each month we also form a “Bottom 10” portfolio of the 10 ETFs with the smallest, or most negative, Estimate Revisions Diffusion, re-selecting and rebalancing monthly.
Source: Graph created by author using data from FactSet
In the graph above, the blue line is the cumulative log of residual return of an equal-weighted portfolio of the 10 ETFs with the highest Estimate Revision Diffusion, rebalanced monthly. Since 2006, the average log of residual return (net of risk effects such as equity market and interest rate betas) has been 1.3% per year on average. The orange line is the same thing but investing in the 10 with the lowest (or most negative) Estimate Revisions Diffusion. That return has been -10.0%. The green line is a long-short implementation of the strategy. Its return has been 11.3% per year.
Again, please note that we are measuring cumulative residual return, not cumulative total return.
Source: Graph created by author using data from FactSet
As of February 28, 2022, VanEck Steel ETF (SLX) had an Estimate Revisions Diffusion standardized factor exposure of 1.00, meaning that it was one standard deviation above the universe mean. This was in the top quintile of all sector and industry ETFs.
Putting It All Together
The four factors analyzed above represent a subset of the factors that we currently use in our sector and industry ETF return model, but they are some of the most important ones. In addition to the factors that we use to forecast risk-adjusted return, we also forecast risk-related return. For equity ETFs, this forecast is primarily driven by our return expectation for the overall stock market and the ETF’s stock market sensitivity or “beta.” Our total return forecast for an ETF is the sum of its residual return forecast and its risk-related return forecast. We only forecast monthly returns, not annualized returns, because the return forecasts are dynamic, especially for residual returns.
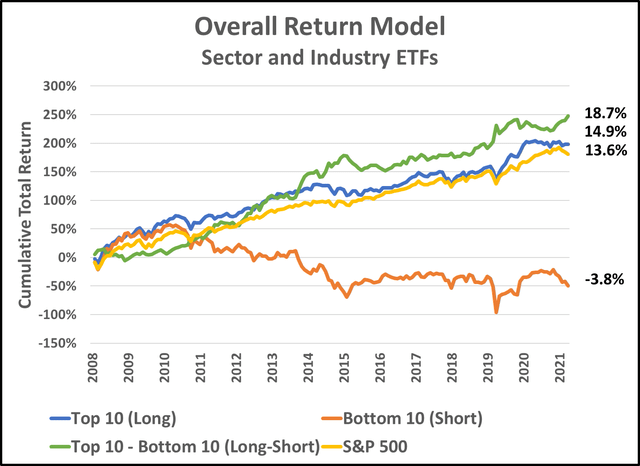
The graph below illustrates one of our research tests for the overall return forecasts for sector and industry ETFs. We begin our test at the end of 2007 when the number of ETFs with total return forecasts was 70. (Currently, all 90 of the ETFs in our universe have total return forecasts.) At the end of each month, we form a “Top 10” portfolio of the 10 ETFs with the highest Total Return Forecasts. Each has a 10% weight. We calculate the total return of this portfolio during the month and then re-select and rebalance the “Top 10” portfolio at the end of the next month, and so on. Similarly, at the end of each month we also form a “Bottom 10” portfolio of the 10 ETFs with the smallest, or most negative, Total Return Forecasts, re-selecting and rebalancing monthly.
Source: Graph created by author using data from FactSet
In the graph above, the blue line is the cumulative log of total return of an equal-weighted portfolio of the 10 ETFs with the highest Total Return Forecasts, rebalanced monthly. Since 2007, the average log of total return has been 14.9% per year on average. (This compares to the total return of the S&P 500 of 13.6% over the same time period.) The orange line is the same thing but investing in the 10 with the lowest (or most negative) Total Return Forecasts. That return has been -3.8%. The green line is a long-short implementation of the strategy. Its return has been 18.7% per year.
Source: Graph created by author using data from FactSet
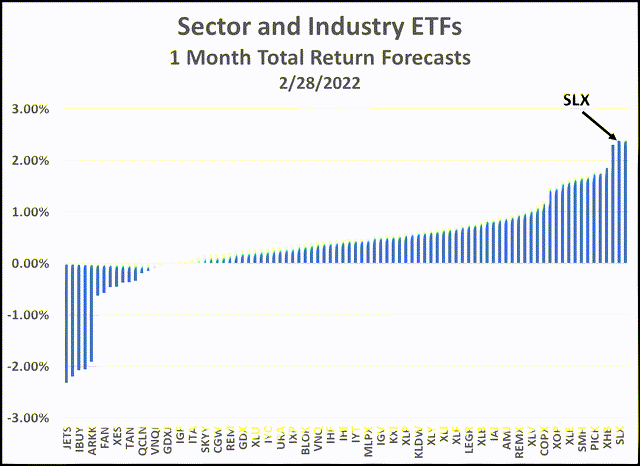
As of February 28, 2022, VanEck Steel ETF (SLX) had a Total Return Forecast of 2.39% for the next month. By comparison, our forecast of the total return for the S&P 500 on that date was .59% for the next month. SLX had the second-highest total return forecast. (The highest forecast was for iShares U.S. Home Construction ETF [ITB], an ETF that was the subject of an earlier article.
Subjective Risk Considerations
If you have read this far, you can tell that we do not base our ETF return forecasts on subjective concerns. However, that does not mean that we ignore non-quantifiable risk considerations. With respect to SLX, the following are what we believe are the major risks:
Economic Growth/Recession Risk. The steel industry is cyclical and very economically sensitive. The demand for steel tends to be driven by major business and consumer purchase/investment decisions. A lot of steel goes into steel girders for high-rise construction, steel pipe for all kinds of construction, and steel plate for autos and appliances. These purchases tend to be postponed or cancelled in the event of an economic growth slowdown or recession, curtailing demand, and reducing industry revenues.
Inflation Risk. Although steel companies have historically had the ability to pass along increased costs through increased steel prices, they are not immune to the risk of being pinched by inflation. For steel companies, the major costs are raw materials (particularly iron ore), energy, and labor. The prices for all of these have seen dramatic increases recently.
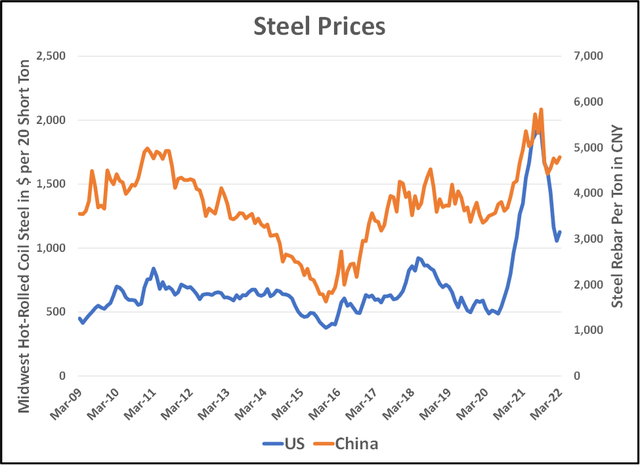
China Policy Changes. According to the World Steel Association, China, accounts for over 10 times the consumption of steel compared to the next highest country, India. China is also the world’s largest producer of steel, and by a similar factor of 10. It is both the largest exporter of steel and the largest importer of steel. This makes China the dominant factor in steel pricing around the world. In September 2020, President Xi Jinping announced aggressive “decarbonization” goals for China. In 2021, the government announced a cap on steel production that would not allow any growth in production above 2020 levels. Tax rebates to encourage the steel exports were eliminated, and Chinese steel production declined for the first time in six years. Export duty taxes for steel scrap remained at 40% to encourage the recycling of steel. The suppression of Chinese steel exports has no doubt had a positive impact on steel pricing over the past year. Whether these policies will be maintained is open to question. As shown in the graph below, steel futures prices have dropped in recent months, but remain well above historical averages.
Source: Graph created by author using data from FactSet
Summary
- VanEck Steel ETF (SLX) has favorable value characteristics:
- 5.1% dividend yield
- 4.0 price/earnings ratio
- 1.4 price/book ratio
- It has done a good job of protecting against inflation historically
- Factor analysis shows it has very favorable factor exposures:
- Value: high EBIT/EV
- Momentum: strong trailing 12-month exponentially-weighted returns
- Quality: high profitability as measured by ROIC (return on invested capital)
- Sentiment: upward revisions of analyst earnings estimates
- SLX has very high forecasted total return
- The major risks are
- Economic slowdown/recession
- Inability to pass along rising costs (inflation)
- Unfavorable changes in Chinese government policy
[ad_2]
Source links Google News

