[ad_1]

dontree_m/iStock via Getty Images
Thesis and background
With an almost 8% dividend yield (7.98% as of this writing), the iShares Mortgage Real Estate Capped ETF (REM) appears attractive to many income-oriented investors, especially under a low-rate environment. However, you need to understand the macro credit cycles and the role of yield spread before investing in REM.
When the yield spreads expand or contract, it can signal changes in the underlying economy or financial markets. And the stocks in the mREIT sector are typically the ones that are most sensitive about such changes. The mREIT sector makes money on the spread between the long-term and short-term rates and this spread is narrowing. And it has enjoyed a thick spread (more than 1.5% at this peak) since the 2020 COVID recession because of the Fed’s hard landing. Now, with Fed’s hawkish tapering and anticipated interest rate raises, the spread has begun to narrow (and as narrow as 0.27% as of this writing). And the narrowing is expected to exacerbate and further pressure REM’s profitability as you will see next.
The macro credit cycle
The yield spread between short-term debt instruments and long-term instruments is the most effective indicator of the credit cycle. When yield spreads expand or contract, it can signal changes in the underlying economy or financial markets.
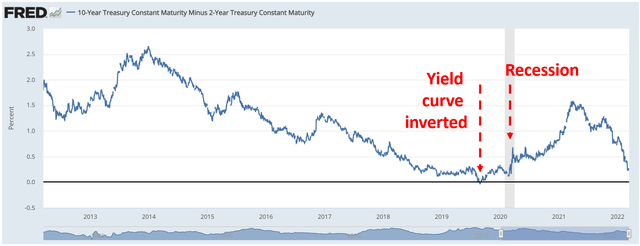
The following chart shows the spread between the 10-Year Treasury Constant Maturity yield and the 2-Year Treasury Constant Maturity yield. Both underlying series are published by the U.S. Treasury Department. As you can see, most of the time, long-term bonds have higher yields than short-term bonds, resulting in a positive yield spread.
However, occasionally, the yield spread turns negative (resulting in a so-called Inverted Yield Curve). The exact mechanism of the inverted yield curve is debatable and can vary from situation to situation. Regardless of the underlying mechanism, the end result is that an inverted yield curve is a strong leading indicator of an impending recession. And we’ve just experienced the most recent incident in 2019 as you can see from the chart below. The yield curve started inverting in August 2019, and a recession followed shortly afterward in early 2020.
The mREIT stocks held in REM are typically the ones that are most sensitive about such yield spread changes, as we will see next.

Source: FRED
REM profit and the macro credit cycle
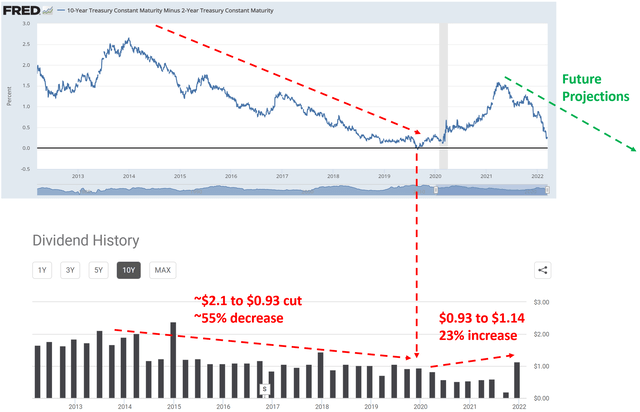
The mREIT stocks held in REM makes its money on the spread between the long-term and short-term rates. The thicker the spread, the easier and the more money they can make, as you can clearly see from the following chart.
This chart overlays the yield spread we’ve just seen above together with REM’s dividend payments, which is used as a metric of the sector’s profitability. As you can see very clearly, when the yield spread is at its thickest (more than 2.5% in 2024), REM enjoyed spectacular profits. The dividend was more than 2.1 dollars a share at that time (and the corresponding dividend yield was more than 15% at that time!). However, as the yield spread gradually narrowed and finally turned negative in 2019, the dividends gradually decreased to only 93 cents per share, an almost 55% cut.
After the recession hit in early 2020, the Fed executed a hard landing move and reduced the short-term rates to essentially 0 (The Fed only has control over the short-term rates. It has no control over the long-term rates). As a result, the yield curve gradually expanded to a very healthy and lucrative level for REM. It peaked at about 1.5% in early 2021.
Now with Fed’s hawkish tapering and anticipated interest rate raises, there are a couple of possible outcomes. Again, remember that the Fed only controls the short-term rates. The long-term rates can change in any fashion (stay put, rise more slowly, or rise more quickly than the short-term rates) and lead to either expanding or contracting yield spread.
Unfortunately for REM, the spread is taking the direction of contracting so far as seen. Since its peak of 1.5% in early 2021, it has contracted to the current level of 0.27%, a more than 123 basis points contracting. And according to Fed’s dot-plot, the short-term interest rates will gradually rise to 2.5% to 3% level in a few years. I expect the long-term rate to rise no more than that, i.e., to stabilize in the 2.5% to 3% in the long term also (long-term rates eventually cannot rise above inflation or GDP growth – otherwise, our government would have solvency issues). This means the narrowing is expected to continue and further pressure REM’s profitability.
This is why REM’s current ~8% dividend yield, though mouth-watering in absolute terms, is far below the historical average. It is actually near a record low in a decade, precisely because of the governing dynamics of the credit cycles.

Source: Author based on FRED and Seeking Alpha data.
REM stock price and the macro credit cycle
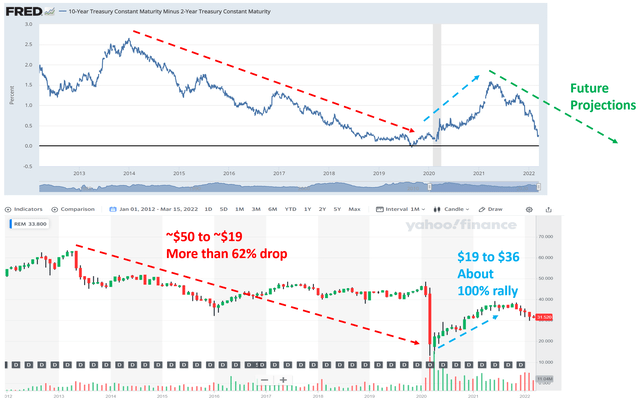
Finally, you must also be wondering how the stock price responded to the credit cycle. Did the stock price appreciate over the past to make up for the dividend cuts? The answer is, unfortunately, no, as you can see from the following chart.
The stock price responded to the credit cycle pretty much in the same way as the profitability. As you can see, in the first macro cycle between 2014 and 2019, the stop price dropped from its peak level of ~$50 in 2014 to about $19 (a more than 62% drop) when the yield spread narrowed from above 2.5% to negative. And during the credit expansion cycle from early 2020 to early 2021, the yield spread expanded from negative to a peak level of 1.5%. And the stock price rallied from $19 to $36, an almost 100% rally, in tandem.
Now, as the yield spread began to narrow again since early 2021 from the peak of 1.5%, the stock price has also been under pressure.
Looking forward, as mentioned above, I expect the yield spread to further narrow, which would keep pressuring the stock price, together with the dividends.

Source: Author based on FRED and Yahoo Finance data.
Conclusion and final thoughts
If you are looking for income, you may be attracted to an ~8% dividend yield from REM – for very good reasons. The yield is very appealing given the current low-interest-rate environment, it beats even the higher end of inflation projection. However, you need to understand the macro credit cycles before investing in REM. Specifically,
- The underlying stocks held in REM makes money on the spread between the long-term and short-term rates and this spread is narrowing. Unfortunately, the spread is taking the direction of contracting since its peak of 1.5% in early 2021. Moreover, according to Fed’s dot-plot, the short-term interest rate will gradually rise to 2.5% to 3% level in a few years. I expect the long-term rate to rise no more than that, i.e., to the 2.5% to 3% range too. Long-term rates eventually cannot rise above inflation or GDP growth – otherwise, our government would have solvency issues. This means the narrowing is expected to continue and further pressure REM’s profitability.
- This is why REM’s current ~8% dividend yield, though mouth-watering in absolute terms, is far below the historical average. It is actually near a record low in a decade, precisely because of the governing dynamics of the credit cycles.
- In case you are wondering how the stock price responded to the credit cycle? And did the stock price appreciate to make up for the dividend cuts? The answer is unfortunately no. The stock price responded to the credit cycle pretty much in the same way as the profitability. Looking forward, I expect the narrowing yield spread to keep pressuring the stock price, together with the dividends.
[ad_2]
Source links Google News

