[ad_1]

Terry Vine/DigitalVision via Getty Images
Please note the following:
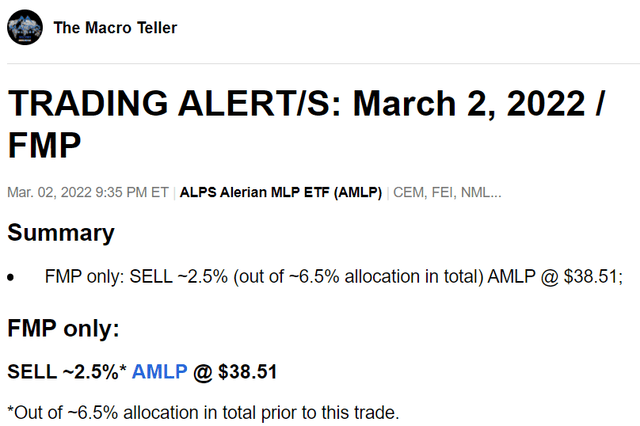
- This article is based on a trading alert that was published for Macro Trading Factory’s (“MTF”) subscribers on March 2.
- Funds Macro Portfolio (“FMP”) is one of two portfolios featured on MTF, containing only (up to 50) ETFs and CEFs.
Macro Trading Factory (“MTF”)
Advance Notice
Once again, we wish to remind you that in most cases we don’t “surprise” you and you know exactly what to expect from us, well in advance.
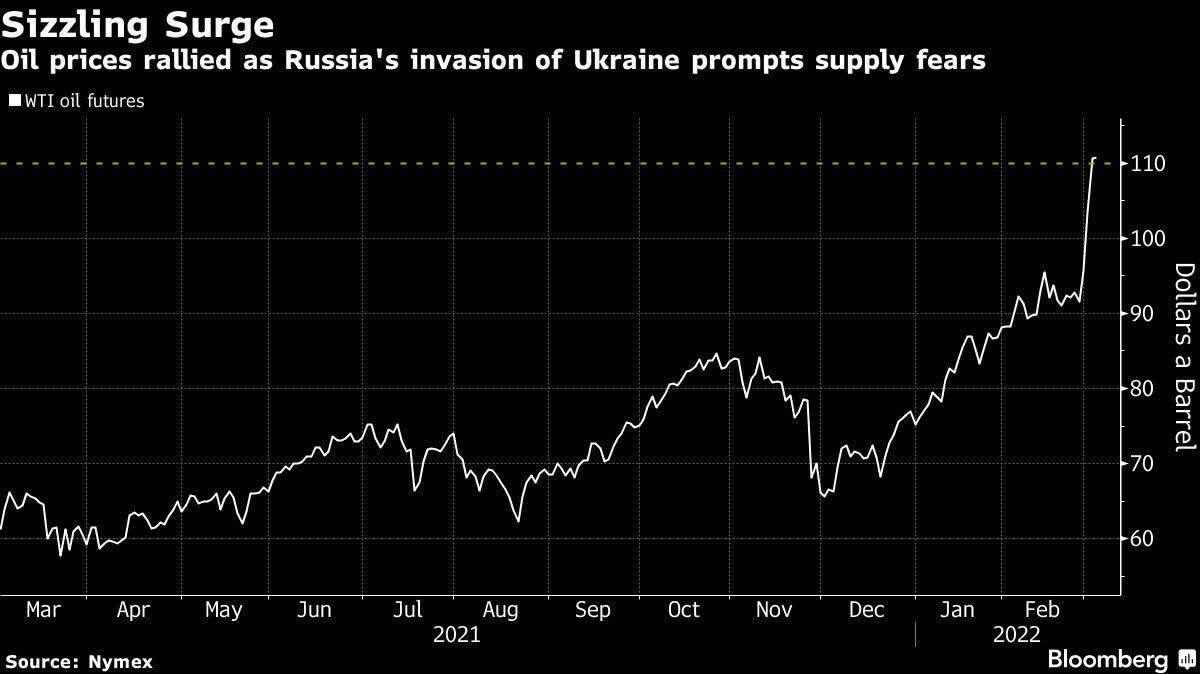
Nine days ago, on Presidents’ Day, we specifically wrote (under the “upcoming tactical moves” section) that “Taking advantage of oil reaching $100 to start lightening up on Energy (while remaining bullish)” is within our (near-term) intention.
We also mentioned several times in recent months that if and when oil prices reach $100/barrel, it would be a catalyst for us to start reducing our gigantic exposure to the energy sector.
Needless to say that nine days ago we didn’t know if and when Vladimir Putin may start a war, (and even if he does) surely not what would be the scope of it.
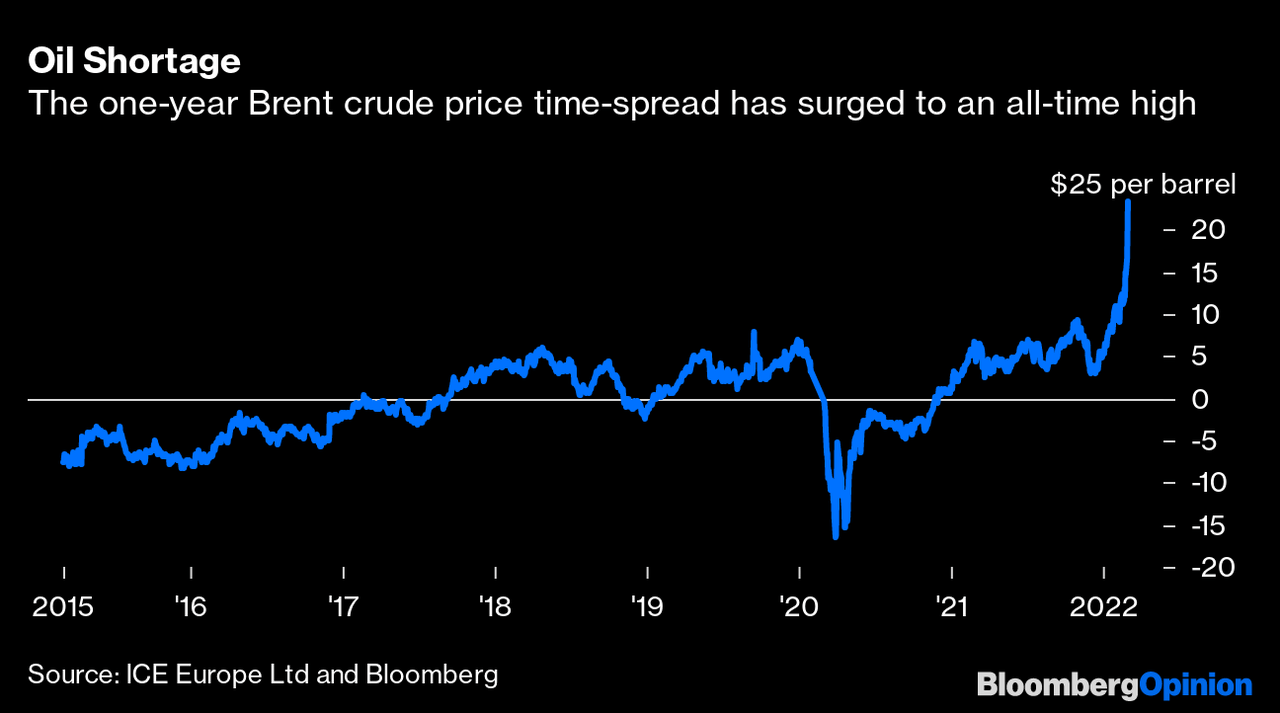
Neither the exact timing (to start lightening-up) nor the $100/barrel, was a “guaranteed trigger” before the war started, surely not once the Russia-Ukraine war became a (devastating) fact of life, giving oil prices the biggest boost they’ve got in years/decades.
Bloomberg
Bloomberg
As such, and as soon as the war started, we knew that we’re going to wait a while longer, letting the winners keep winning.
Just as $100/barrel hasn’t been a “holy number,” neither $110, nor $115, or $120 for that matter, is.
Why do we take action now then? For three reasons:
- Without pretending to be geopolitical analysts we believe that the Russia-Ukraine war won’t last for too long.
- Everybody is trying/aiming to pour more oil into the market these days (out of the emergency reserves), to cover for the Russian shortage. OPEC hasn’t surrendered as of yet, but we believe it won’t be long before they do too.
- Based on recent reports, a new deal with Iran is about to get signed. That would allow Iran to supply much more oil than it currently (at least officially) does.
In more simple words, while all the known/obvious forces are currently pushing oil prices up further, there can be some significant headwinds – and real soon.
Are we turning bearish on oil and/or energy stocks? No, not at all! We remain very much bullish, however we simply wish to take advantage of the current (extreme/radical) situation to lighten up a bit on what’s a very large energy exposure of ours.
It’s never a bad move to take some chips off the table when you have the upper hand – and what a hand this energy play has been!
Recall that at the end of 2020, when the FMP was launched, we announced the following trades:
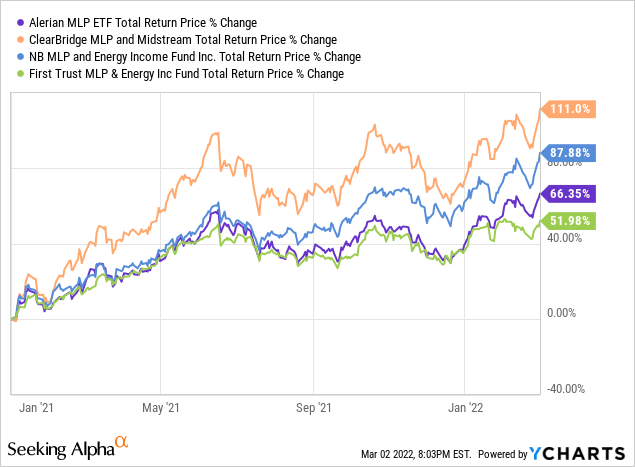
- Bought 5% of Alerian MLP ETF (AMLP). This position has gone up (total return) ~63% and it’s now worth ~6.5% of the portfolio.
- Bought 3% of NB MLP and Energy Income Fund Inc. (NML). This position has gone up (total return) ~87% and it’s now worth ~4.7% of the portfolio.
- Bought 3% of ClearBridge MLP and Midstream (CEM). This position has gone up (total return) ~106% and it’s now worth ~5% of the portfolio.
- Bought 3% of First Trust MLP & Energy Inc Fund (FEI). This position has gone up (total return) ~33% and we sold it on July 19, 2021.
What has started as an allocation of 14% out of a gross long exposure of ~120% (if we recall correctly) is now a 16% allocation out of a gross long exposure of ~196%, after selling FEI along the way…
What is the (rich people’s) problem here you may wish to ask?
- 14% out of 120% = ~17%
- 16% out of 196% = ~31.4%
Add the sale of FEI along the way and you can appreciate that while the weighting of energy within the portfolio was kept ~15%, the actual exposure has doubled.
We’ve let the winners win big… We’ve let the winners win more time than we thought we would… We’ve extended the opening shut for the lightening-up show… However, the time has come.
The combination of high (temporary?) geopolitical tension, very high (sustainable?) oil prices, and (likely) more supply/production increase soon is enough to bring us to the point when we start taking some energy chips off the table.
Why do we start the “lightening up” process with AMLP? Here, we have four reasons:
1) The most simple one: It’s the largest exposure out of the three instruments so it’s only natural for it to be reduced first.
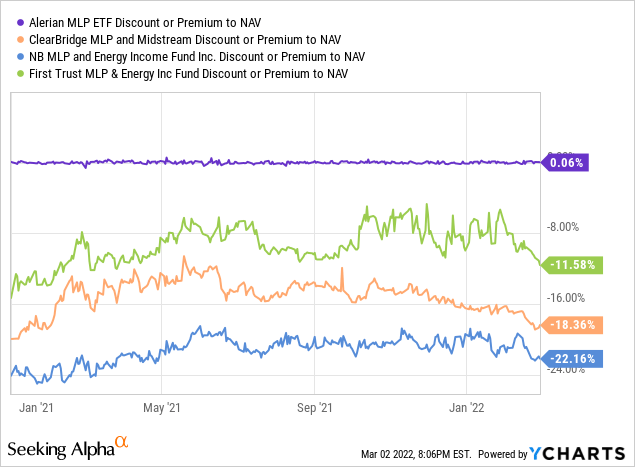
2) AMLP is an ETF that (as all ETFs) don’t (suppose to) trade with a significant discount/premium to NAV. Unlike an ETF, a CEF (Closed-End Fund) can trade at a discount/premium to NAV, and as you can see – both NML and CEM currently trade with a deep discount to their respective NAVs.
Y-Charts
So much so, that they actually trade with a deeper discount than they normally do!

Author
3) Diversification.
While all three funds are focusing on the energy sector, AMLP is 100% energy/MLPs whereas NML and CEN are more diversified.
30.7% of NML is in Utilities (plus 3.2% in other, non-energy, sectors):

Seeking Alpha
3.6% of CEM is in Utilities (plus 1.5% in other, non-energy, sector):

Seeking Alpha
Moreover, while AMLP’s portfolio has only 17 holdings, the portfolios of NML and CEM contain 31 and 30 holdings, respectively, in total.
4) Technically speaking, AMLP has reached a point where it’s likely going to face some resistance.
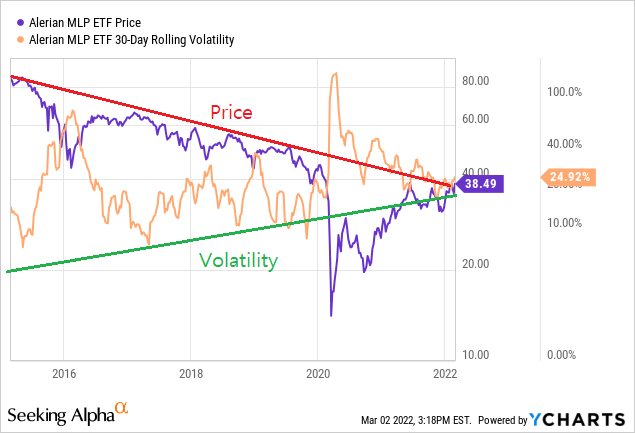
Y-Charts
True, it’s less relevant to use technical analysis when it comes to an ETF, because after all, an ETF is the sum of its parts rather than an operating entity of its own.
Nonetheless, and in spite of the rising channel (green, parallel, lines in the below chart), that leaves more room for AMLP to rise, it’s the long-term down-trending red line that bothers us a bit.
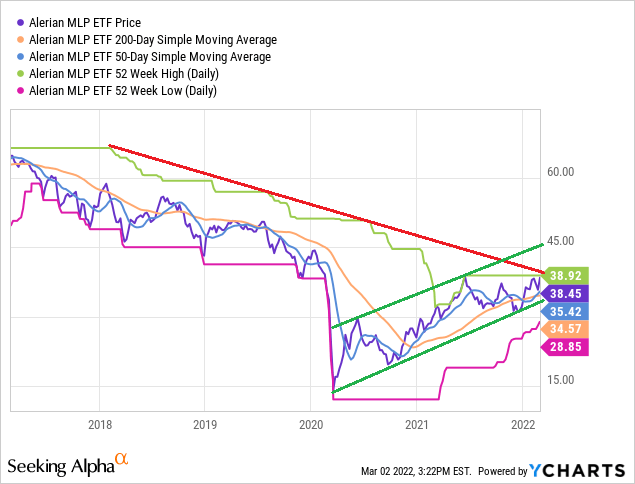
Y-Charts
Although the last reason is the weakest one out of the four, we believe it’s worthwhile watching closely the level where AMLP currently trades at.
It seems like moving over $40 is going to be quite a challenge for AMLP; not out-of-question, of course, but raising some doubts, at the very minimum.
Other worthwhile-mentioning, though not deciding, factors/considerations:
- Distribution Yield (AMLP actually pays better than the two CEFs)
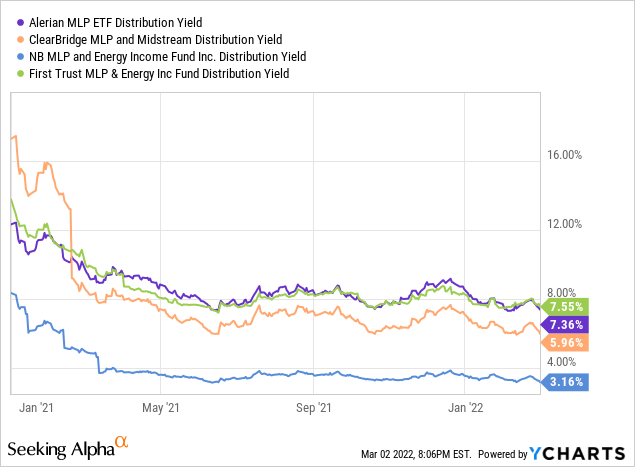
Y-Charts
- Price off-high (Unsurprisingly, they all trade near their recent peaks)
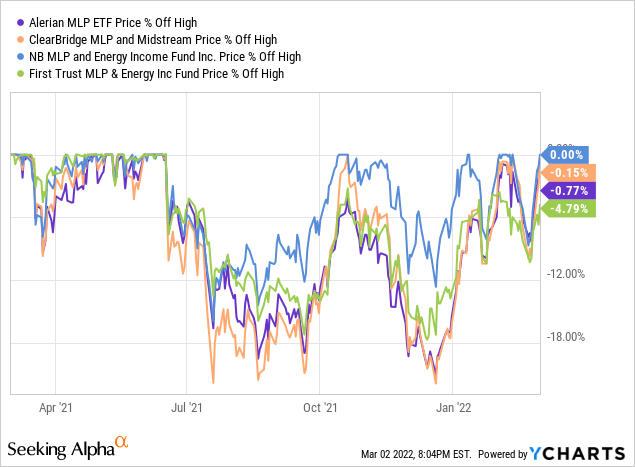
Y-Charts
- Total Return (since 1/1/2021): Ignoring the sold FEI, AMLP is underperforming both CEFs.
All in all, we remain very bullish on oil prices as well as on the energy sector.
The ~13.5% remaining exposure to energy within the FMP is still nearly 10% above the allocation to the sector within the S&P 500.
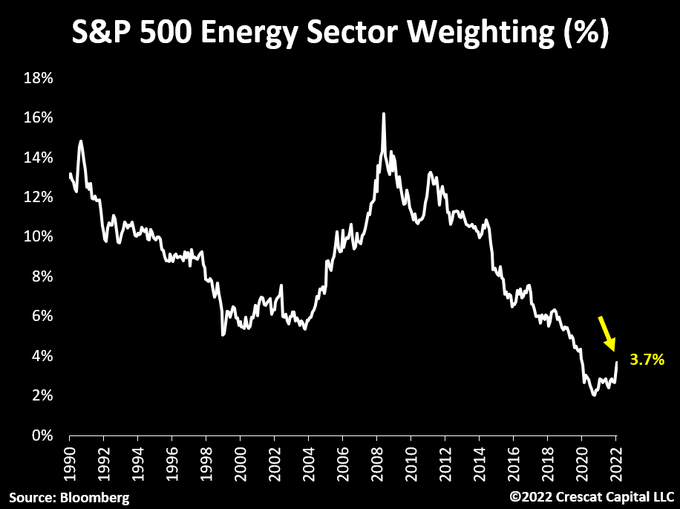
Crescat Capital
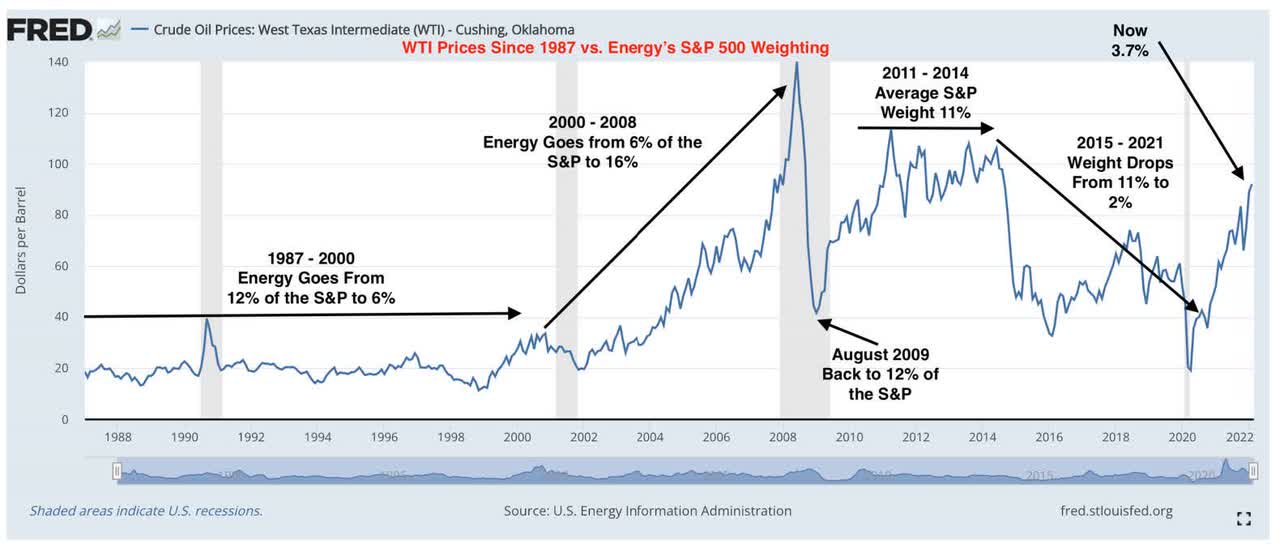
Recall that the S&P 500 Energy (XLE) was either the worst, or second-worst performing sector in seven out of the last 10 years.
The only periods (e.g. 2016, 2021) when the sector outperforms the S&P 500 is after oil prices are bottoming, and start moving solidly and consistently higher.
DataTrek Research
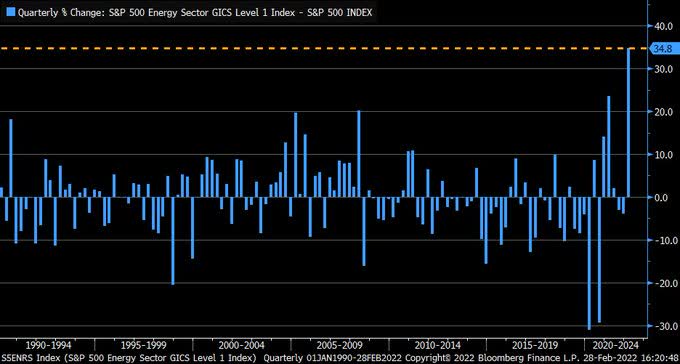
Although 2022 is certainly looking as if it’s shaping this (outperforming) way, we need to be very mindful of the historical performance that we’re witnessing by the energy sector over the past (nearly) two years, generally speaking, and YTD, particularly.
35% is, by far, the most significant outperformance for the Energy sector relative to the S&P 500. Ever.
Bloomberg
Can this continue? Yes it can, but it’s more than prudent to say thank you and start bringing some energy “troops” back home to rest. After all, they have put on an enormous effort and energy into becoming what they’ve become.
[ad_2]
Source links Google News

