[ad_1]

Vladimir Zakharov/iStock via Getty Images
(This article was co-produced with Hoya Capital Real Estate)
Introduction
WSJ.com 10/29/21
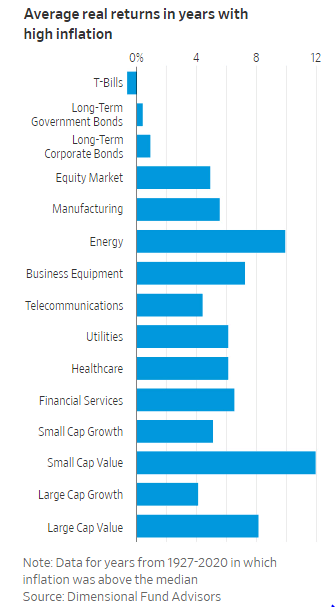
When I found this chart recently, several months after it was published in the Wall Street Journal, it seemed even more relevant now as inflation keeps sitting 40-year old records.
It shows how selected market segments or sectors have performed when inflation was above the median since 1927. The two Value-stock segment results placed #1 (Small-Cap) and #3 (Large-Cap), with Energy stocks in between.
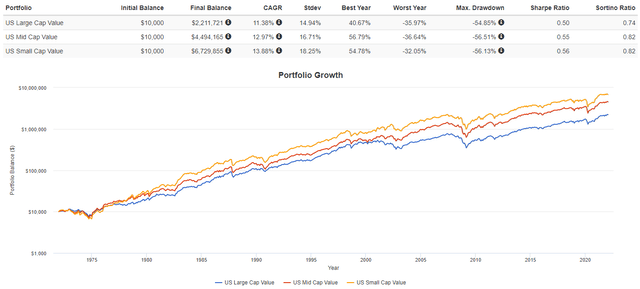
With data back to before the Great Depression, I used PortfolioVisualizer to see if that still held, at least in the ranking of the Value stock results.
portfoliovisualizer.com
Since 1972, of the three size classifications, the Small-Cap also placed first, with Mid-Cap second and Large-Cap trailing both. This prompted me to find one or two well-performing Small-Cap Value ETFs to analyze.
Exploring the iShares S&P Small-Cap 600 Value ETF
Seeking Alpha describes this ETF as:
It is managed by BlackRock Fund Advisors. It invests in public equity markets of the United States. The fund invests in stocks of companies operating across diversified sectors. The fund invests in value stocks of small-cap companies. The fund seeks to track the performance of the S&P SmallCap 600 Value Index. IJS started in 2000.
Source: seekingalpha.com IJS
IJS has $8.8b in assets and provides investors with a 1.57% yield. The managers charge 18bps in fees.
Understanding the Index used
S&P describes the S&P SmallCap 600 Value Index as:
We measure value stocks using three factors: the ratios of book value, earnings, and sales to price. S&P Style Indices divide the complete market capitalization of each parent index into growth and value indices. Constituents are drawn from the S&P SmallCap 600®.
Source: .spglobal.com SPSV Index
The Index uses float-adjusted market-cap to weights its components. Rebalancing occurs in the last month of each quarter. Some vital statistics include:

spglobal.com IDX Factsheet
The first step in building the Index is ranking the S&P Total Market Index by Growth and Value factors.

spglobal.com IDX Methodology
This how they explain the process:
Raw values for each of the above factors are calculated for each company in the S&P Total Market Index. These raw values are first winsorized to the 90th percentile and then standardized by dividing the difference between each company’s raw score and the mean of the entire set by the standard deviation of the entire set. A Growth Score for each company is computed as the average of the standardized values of the three growth factors. Similarly, a Value Score for each company is computed as the average of the standardized values of the three value factors.
Source: spglobal.com IDX Methodology
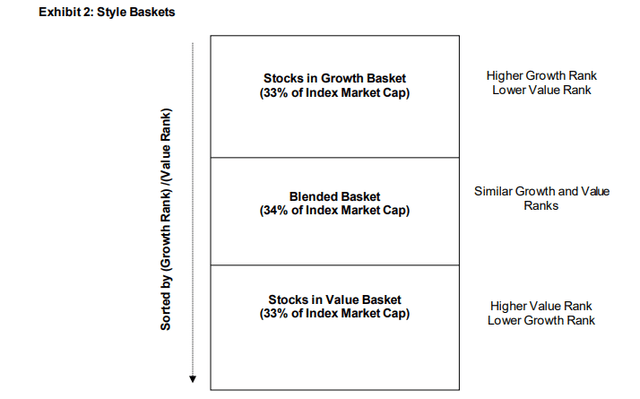
When this is completed, the stocks fall into one of three style baskets.
spglobal.com IDX Methodology
The middle 34% of float market capitalization consists of companies that have similar growth and value ranks. Their market capitalization is distributed among the Style indices based on their distances from the midpoint of the Growth basket and the midpoint of the Value basket. These stocks appear in both the Growth and Value Indices, with each allocation based on where its Growth/Value score falls. Currently, 187 stocks appear in both Indices.
IJS Holdings review
The current sector allocation looks like this:
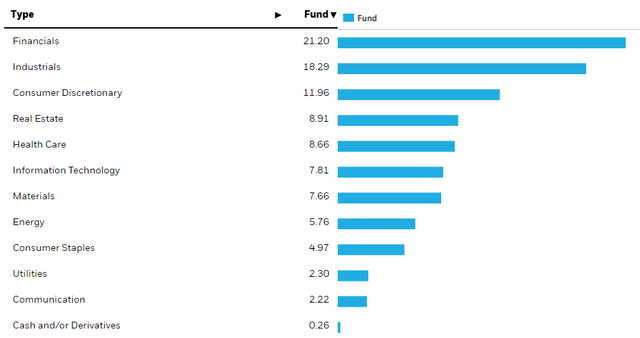
ishares.com IJS
The Top 3 sectors should all perform well when the economy is growing. More on sectors in the Comparison section of this article. The Top 20 holdings are:
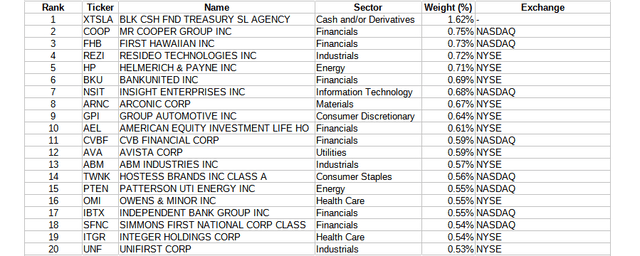
ishares.com; compiled by Author
Not counting the cash, the rest of the Top 20 represent 12.5% of the assets. The most recent data shows 514 holdings, including a negative cash position that almost offsets the largest holding.
IJS Distribution review

Seekingalpha.com IJS DVDs
IJS skipped the 4th payout in 2020. They more than made up for that with the last two payments in 2021, both near $.50. Unless they continue at that pace, the quoted yield is overstated by up to 30bps. Those fluctuations could have affected the Seeking Alpha Dividend grade, which currently stands at “A”.
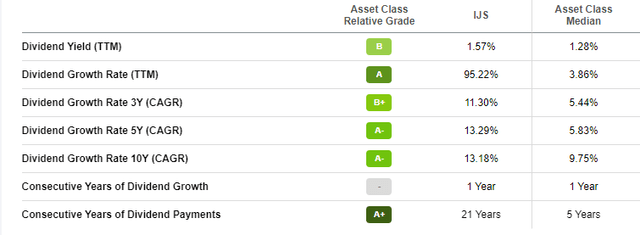
seekingalpha.com IJS DVD grades
Exploring Vanguard Small-Cap Value ETF
Seeking Alpha describes this ETF as:
The Vanguard Small-Cap Value ETF is an exchange traded fund launched and managed by The Vanguard Group, Inc. The fund invests in public equity markets of the United States. The fund invests in stocks of companies operating across diversified sectors. It invests in value stocks of small-cap companies. It seeks to track the performance of the CRSP US Small Cap Value Index. VBR started in 1998.
Source: seekingalpha.com VBR
VBR is the bigger of the two at $24.4b in assets and provides a higher yield at 1.8%. Vanguard charges 7bps in fees.
Understanding the Index used
The Center for Research in Security Prices, or CRSP, describes the Index as:
The CRSP U.S. Value Style Indexes are part of CRSP’s investable index family. Once securities are assigned to a size-based market cap index, they are made eligible for assignment to a value or growth index using CRSP’s multifactor model. CRSP classifies value securities using the following factors: book to price, forward earnings to price, historical earnings to price, dividend-to-price ratio and sales-to-price ratio.
Source: crsp.org Index
CRSP added two factors to what iShares used to classify a stock as Value: forward earnings-to-price and dividend-to-price. For those who like to “get into the weeds”, this diagram explains the Growth or Value assigning process.
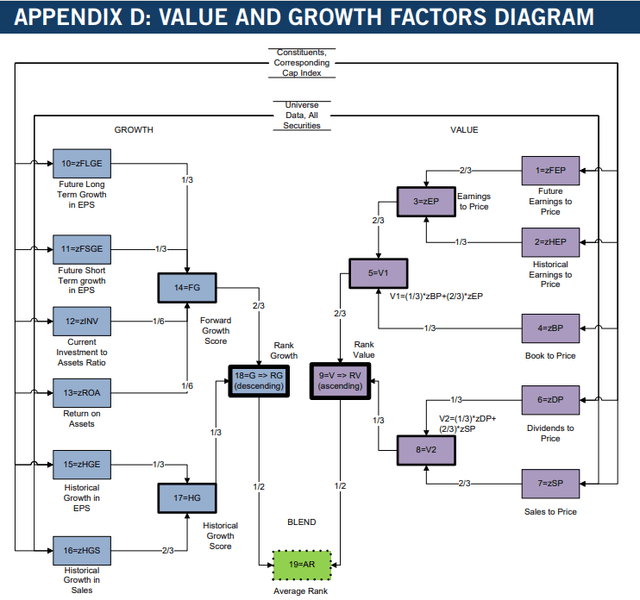
crsp.org Index Methodology
The CRSP US Small Cap Value Index vital statistics are:
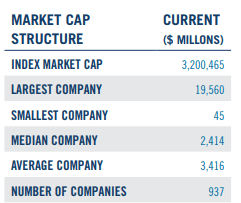
crsp.org Index
The CRSP Index contains twice the number of stocks as the iShares Index, which might explain its higher market-cap data. The market-cap range is much wider with the largest stock 5X what the other index holds. The CSRP Median and Average market-cap values are also much larger, between 1.5-2X. This obviously will mean the ETFs will hold different universes of stocks.
CRSP describes their Index Methodology as:
- CRSP assigns companies eligible for the US Total Market Index to size-specific capitalization-based indexes using the company’s total market capitalization calculated using TSO. Unlike count-based indexes, the CRSP Indexes do not have a limit on the number of index constituents. Stocks between 85-98% are classified as Small-Cap.
- All CRSP indices are reconstructed each quarter.
- The CRSP Indexes are designed to represent the market of investable US equity securities. They encompass equity securities including common stocks and real estate investment trusts (REITs) of US companies that are listed on a CRSP exchange of interest – NYSE, NYSE American, NYSE ARCA, NASDAQ, BZX Exchange, and the Investors Exchange.
- CRSP has established four tests to determine if the company is a US equity. As such, ADRs and the like are not eligible.
- CRSP uses a banding process to minimal index disruption due to market-cap movements. They provided the following diagram.
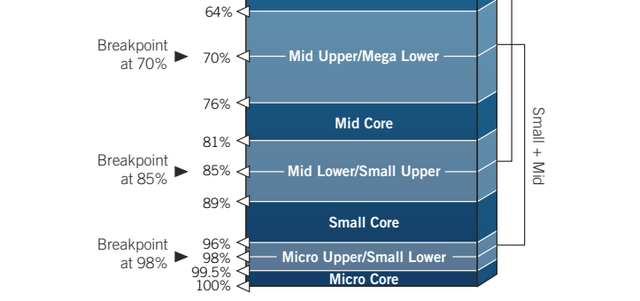
crsp.org IDX Methodology
VBR Holdings review

seekingalpha.com
VBR is weighted to their top 4 sectors, with over 60% of the assets in those sectors. Like IJS, Technology stocks, no surprise, are not high on the Value scale.
The Top 20 stocks are and these are about 10% of the portfolio.
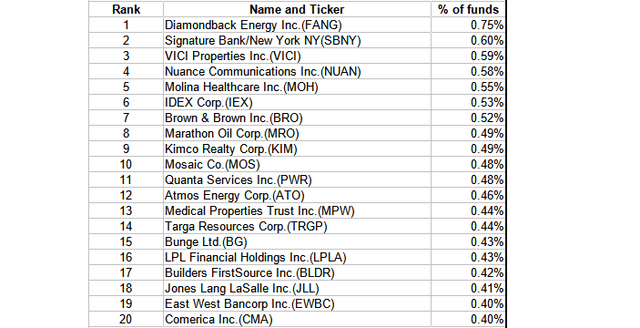
investor.vanguard.com, compiled by Author
Overall, VBR holds 1000 stocks. Surprisingly, none of these stocks made the Top 20 in IJS.
VBR Distribution review

seekingalpha.com VBR DVDs
Since 2016, VBR has paid dividends quarterly. Like other ETFs I have reviewed, the last payout each year is usually the biggest. Seeking Alpha grades this dividend performance as a “B+”, a bit lower than IJS scored.
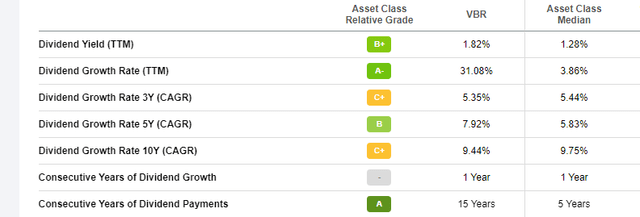
seekingalpha.com VBR DVD grades
Comparing IJS to VBR
PortfolioVisualizer.com
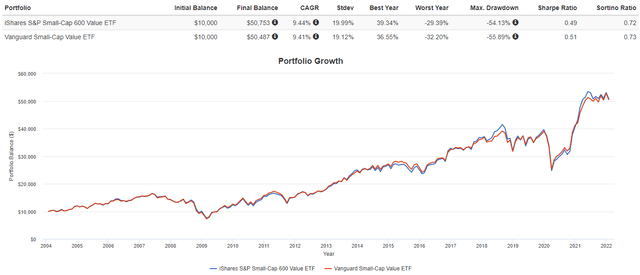
In the most important criteria for most investors, despite using different indices, the CAGRs are within 3bps and the StdDev within 1%. Looking inside, this is how the two ETFs are invested in today’s market.
The following two data sets were generated using the Seeking Alpha Portfolio feature. They appear to give different pictures as to which ETF is more Value oriented. The first seems to favor IJS, the second set VBR.

seekingalpha.com Valuation

seekingalpha.com Profitability
WisdomTree.com Comparison tool
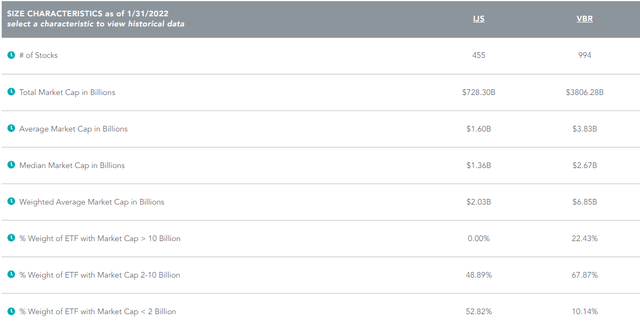
Looking at this, VBR appears to have a much wider definition for Small-Cap stocks. This could be due to the larger overall universe they start from.
WisdomTree.com Comparison tool
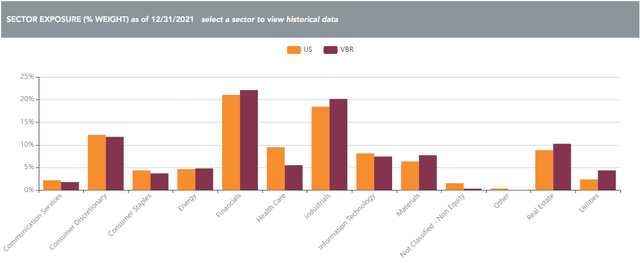
At least an investor doesn’t have to pick either ETF based on how they feel about individual sectors as the weighting differences across the board are little. HealthCare has a 4% difference, with Utilities 2% in the other direction.
The ETFs share 261 stocks, with only 14% market-cap in common. With VBR holding more stocks, 58% of IJS’s stocks are held by VBR; only 29% in the other direction.
ETFRC.com
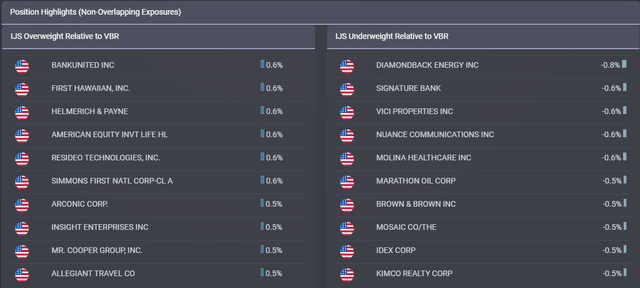
The above shows where the ETFs weights differ the most in both directions. Many of these stocks appear in the Top 20 lists of the respective ETF.
WisdomTree also rates stocks on Quality and Value metrics.
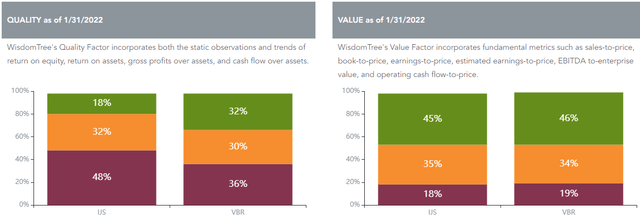
WisdomTree.com Comparison tool
While VBR rates better on their Quality scale, the two ETFs are very even on their Value scale. Key: Green=good; Maroon=poor.
Portfolio Strategy
Almost one year ago, I wrote Pondering Growth Vs. Value, which readers might want to read if they are on the fence about whether this is a good time in the market to be Value-focused. Other Seeking Alpha Contributors recently tackled this topic too. Both iShares and Vanguard have both Growth-focused and Blended Small-Cap ETFs to explore if Value-focused isn’t where you are as an investor or are already well situated in that sector.
Between these two ETFs, my preference is the iShares S&P Small-Cap 600 Value ETF as its more of a pure Small-Cap ETF than the Vanguard Small-Cap Value ETF. There are two other ETFs that use the S&P SmallCap 600 Value Index. If you like IJS but prefer Vanguard ETFs, the Vanguard S&P Small-Cap 600 Value ETF (VIOV) is available. Naturally S&P offers a competing ETF, the SPDR S&P 600 Small Cap Value ETF (SLYV) to consider.
Final thought
As I was submitting this article about considering Value ETFs, this fellow Seeking Alpha article was posted I thought readers should be aware of based on inflation expectations: Value Stocks: Inflation Wave Adds Fuel To Recovery
[ad_2]
Source links Google News

