[ad_1]

elgol/E+ via Getty Images
The iShares MSCI Intl Quality Factor ETF (IQLT) delivers a remarkable representation of non-U.S. developed world equities sporting robust quality characteristics.
Since its inception in 2015, it has amassed a portfolio of $4.3 billion; its standardized yield stood at ~2.3% as of end-January. The expense ratio of 30 bps looks fairly low for a smart-beta portfolio, especially compared to the international equity peers from the class.
IQLT might be a fund of choice for American investors seeking international exposure without risks stemming from poor-quality companies overcrowding baskets of broad market ETFs that select holdings without much attention to their P&L, cash flow statements, and balance sheets.
Unfortunately, there are a few flaws not to be overlooked. First, quality (definitions vary) does not necessarily engender market-beating returns, and typically a few years (if not decades) are needed for a quality thesis to play out, if at all. As we will illustrate below, the IQLT portfolio was incapable of outperforming the U.S.-focused peers executing similar strategies in the past, with weaker Sharpe and Sortino ratios. Second, the FX factor should never be ignored by investors seeking opportunities beyond borders. IQLT’s top allocations are the UK and Japan, with both facing uncertain 2022; I am also skeptical that the Swiss franc, the fund’s third most important currency, will indubitably do better when the Fed will proceed with the long-overdue interest rate increases. Considering these risks, IQLT is a Hold.
Investment strategy
According to the prospectus, IQLT tracks the smart-beta MSCI World ex USA Sector Neutral Quality Index.
Its selection pool (or the parent index) is the MSCI World ex USA Index comprising principally large- and medium-size companies (~85% of the equity market capitalization in the developed world without the U.S.).
Its essential purpose is to capture those players in the pool that sport higher quality characteristics compared to their counterparts from the respective GICS sectors. That task is solved using the quality score that amalgamates three parameters, namely Return on Equity, stability of the YoY earnings growth, and leverage. Ideally, a company should generate a robust return on its shareholder equity, should not suffer from EPS volatility (which might point to its inability to adjusted expenses when necessary, too-burdensome interest, hence, probably poor capital allocation, tough competition resulting in unsustainable sales growth, or even contraction, and other issues painting a rather gloomy picture of shareholder value destruction when brought together), and be capable of sustaining all these without relying on borrowings that much.
Scrupulous investors might point to the fact that the score might be incomplete as a few pivotal ingredients are missing, like cash flows. Also, I believe that Return on Total Capital is a better metric than ROE for capital-intensive sectors like materials and industrials. However, the advantage is that its simplicity should result in lower turnover than if a more complicated model was applied.
Upon biannual rebalancing, the weight of a stock in the index is determined using two variables: the QS and its weight in the parent index. The 5% cap is applied to ensure the benchmark would not become too heavy in a few names which might skew performance. To arrive at a final version of the index, managers normalize weights in order to achieve sector neutrality.
Performance analysis
The period in focus encompasses a few years from February 2015 to January 2022 (IQLT was incepted on 13 January 2015).
To investors’ chagrin, the international high-quality equity portfolio trailed both the iShares S&P 500 (IVV) and MSCI World ETFs (URTH) that delivered the ~14.5% and ~11.3% CAGRs, respectively, vs. IQLT’s ~7.7%, even despite the fact that both might carry a number of stocks with horrible quality.
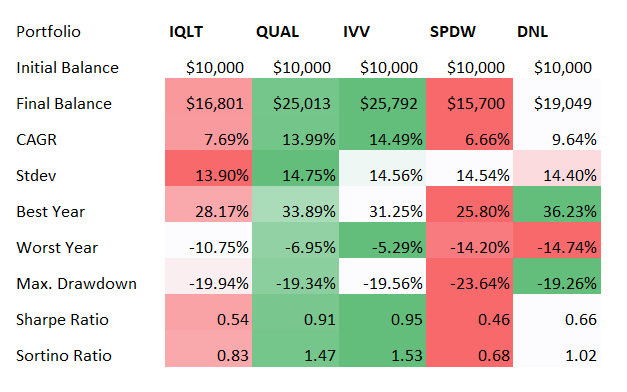
Created by the author using data from Portfolio Visualizer
But there is a nuance. The SPDR Portfolio Developed World ex-US ETF (SPDW) should be a better comparison, as it has no exposure to the U.S. tech behemoths that bolstered the S&P 500’s returns in the past. I have also added the WisdomTree Global ex‐U.S. Quality Dividend Growth Fund (DNL) to this group since the funds have similarities: DNL also ignores U.S. stocks and filter out companies with weak earnings, ROE, and ROA, which I discussed in the article.
In this peer group, the fund scores much better, with the CAGR ~1% higher than SPDW’s, though still lagging DNL.
It should also not go unnoticed that the iShares MSCI USA Quality Factor ETF (QUAL) trailed IVV by around 50 bps, delivering the second-largest return in this cohort.
Why IQLT’s performance was so tepid? More likely, the CAGR reflects the ripple effects of the trade war which had taken its toll on international equity markets before the pandemic. Brexit and subsequent softness in the pound sterling are also certainly amongst the culprits.
Holdings analysis
As of February 18, the fund oversaw a portfolio of 298 equity holdings. Ten key stocks had approximately 27.9% weight.
Compared to the developed world ex-U.S. ETF, IQLT has slightly larger exposure to the UK while a much lower share of the portfolio deployed to the Japanese stocks. Another notable difference is its attention to Switzerland which is in third place with ~13.5% weight. The reasons driving my skeptical outlook on the USD-denominated Swiss equity ETFs were outlined in the January article on EWL. In short, the franc question might potentially dent returns. The bullish case for the yen is also questionable because of tepid inflation in the country. The headwinds the GBP is facing were discussed in my note on DNL linked above.
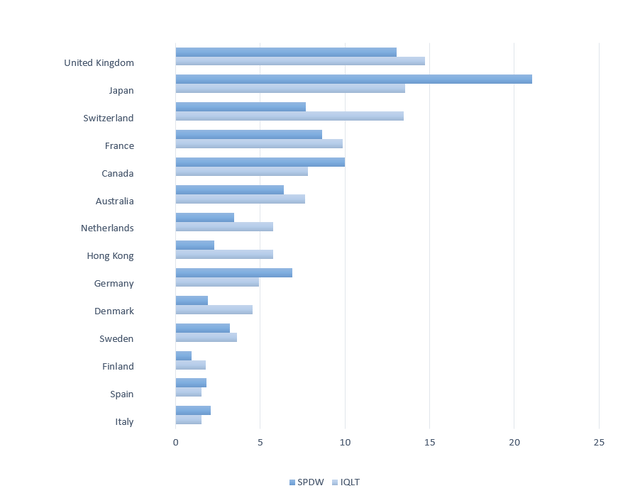
Created by the author using data from the funds
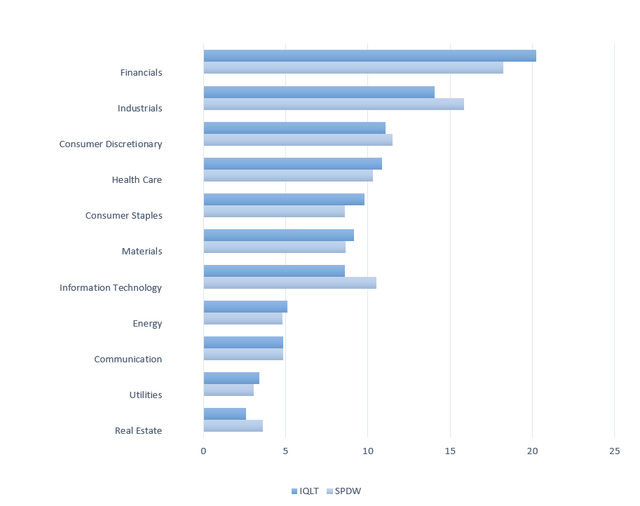
The chart below compares its sector allocations to SPDW’s.
Created by the author using data from the funds
In short, IQLT underweights IT, industrials, and real estate compared to SPDW, though only marginally. Both are heavy in financials, industrials, and consumer discretionary stocks.
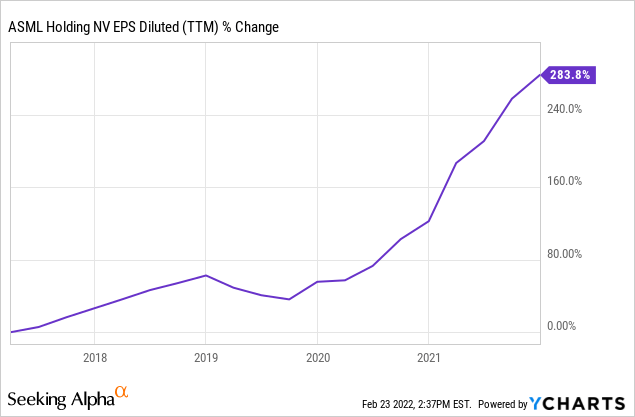
ASML Holdings (ASML), an advanced semiconductor equipment systems producer, is its key holding with a weight of 3.89%. Its presence in the portfolio clearly does not raise eyebrows, as ASML boasts an ROE of 49%. My dear readers can riposte here that such a massive return is probably skewed by the debt load and we must check the balance sheet. However, its Return on Total Capital of ~24.3% of also nothing short of impressive. Debt/Equity is adequate, ~45%. ASML has also delivered phenomenal diluted EPS growth in the previous five years.
Final thoughts
My point is that the quality factor is perfectly aligned with an owner’s mentality, with an attitude of an investor, not a trader. And sticking with quality always makes sense, especially when the markets are jittery. But that by no means immediately implies that every fund with ‘quality’ in its name is a Buy. Unfortunately, IQLT is not the best option in my view since FX risks stemming from the possible USD appreciation overshadow an otherwise strong thesis.
Also, its ~2.4% dividend yield is far from being a bumper one, even below the asset class median of ~2.9%, with a lackluster 5-year compound annual growth rate of around 4.3%. My best guess here is that the focus on quality factor has resulted in the fund routinely selecting companies prioritizing injecting generated cash flow surplus back into business, bolstering growth opportunities, or probably reducing leverage, thus targeting capital appreciation, and not pouring cash to shareholder coffers.
As a brief digression, what fairly surprised me here is that IQLT managed to somehow deliver a standardized yield that is above the one OEUR has, the fund I covered around three weeks ago, ~2.4% vs. ~1.7%, and more likely partly because of its lower expense ratio of 30 bps vs. OEUR’s 48 bps.
All things considered, IQLT is a Hold.
[ad_2]
Source links Google News

