[ad_1]

Hands up if you need a break
erdre/iStock via Getty Images
I have been arguing since last year that as the ‘secular’ tech boom collapses and likely brings the rest of the market down with it in the 2020s, markets are likely to be dominated by the cyclicals that were so unloved throughout most of the last decade. That means not only that cyclical stocks (with energy in vanguard) will outperform tech and the broad indices but that all markets will behave more cyclically. Gone will be the great thematic decadal waves and in its place will be the relative choppiness of commodity-style volatility. Indeed, as I have argued before, the transition to cyclical markets typically begins before the ‘secular’ bull market ends. Thus, at the end of those bull markets, there is a surge in commodities (especially energy) and interest rates, and then comes the collapse. In other words, there is a cyclical collapse compounded by a secular collapse, or vice versa.
There is still some way to go before finding out whether my worst fears about market performance will be realized (I think that the recent highs in the major indexes are likely to be generational highs, but needless to say, markets could rally again before it is all over). But while we watch the Techtanic sink, we should also be on the lookout for the cyclical downturn. Once the cycle breaks, that is likely to accelerate the disaster.
It appears to me that this weakness, starting with the communications sector (XLC) and then moving through technology (XLK) and consumer discretionary (XLY) sectors, is now softening up industrials (XLI) and basic materials (XLB) and will soon enough infect energy (XLE) and financials (XLF) and, at some point, staples (XLP) and utilities (XLU), too.
Industrial weakness becoming hard to ignore
In this article, I am going to focus on large- and small-cap industrial indexes, and perhaps later this week, I will write about basic materials. Both XLI (or more formally, the Industrial Select Sector SPDR Fund) and XLB have been lighting up my sell indicator in February, and I wanted to get a closer look to see how seriously I ought to take that signal.
The reason I suspected these signals might be false was because these sectoral indices often tend to contain stocks that do not correlate with the core theme because they are more related to something else.
For example, the Waste and Disposal Services Index (DJUSPC) is classified as industrial but seems to track somewhat better with tech stocks.
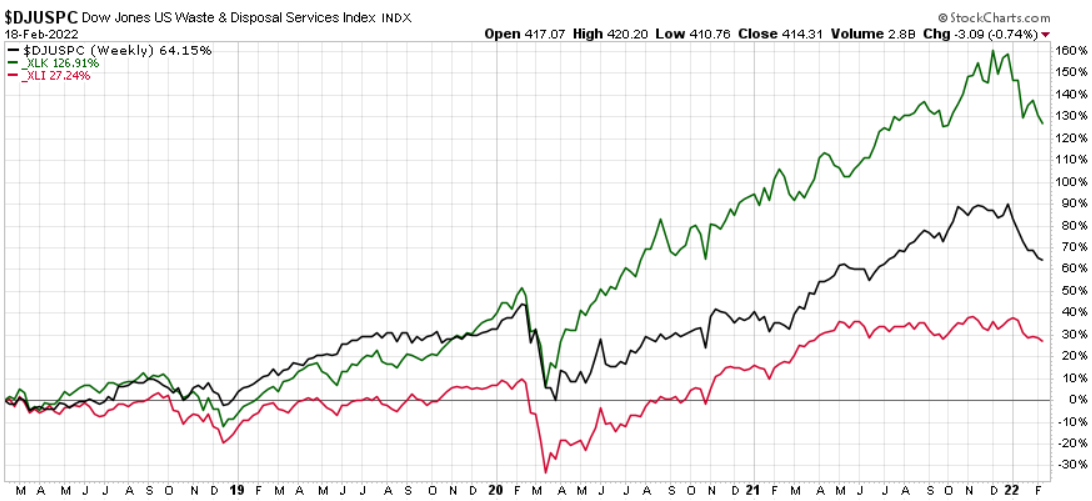
Chart A. Some elements of XLI track better with tech stocks (Stockcharts.com)
If waste and disposal services are actually tech companies (I suspect they are), then it is possible that the tech downturn could be dragging industrial indices down, making it appear as if there is an industrial slowdown.
It certainly seems likely that waste and disposal services companies are dragging XLI down to some degree, but in the end, they form such a small portion of the index that it is unlikely that they are bringing the industrial sector as a whole down to near 52-week lows. But, then again, perhaps there are other such tech-like subindustries that are collaborating with DJUSPC to weaken XLI from within?
So, let’s break XLI apart and see what’s inside.
What’s in the XLI?
The following table from S&P Global shows the sectoral and industrial components of the XLI.
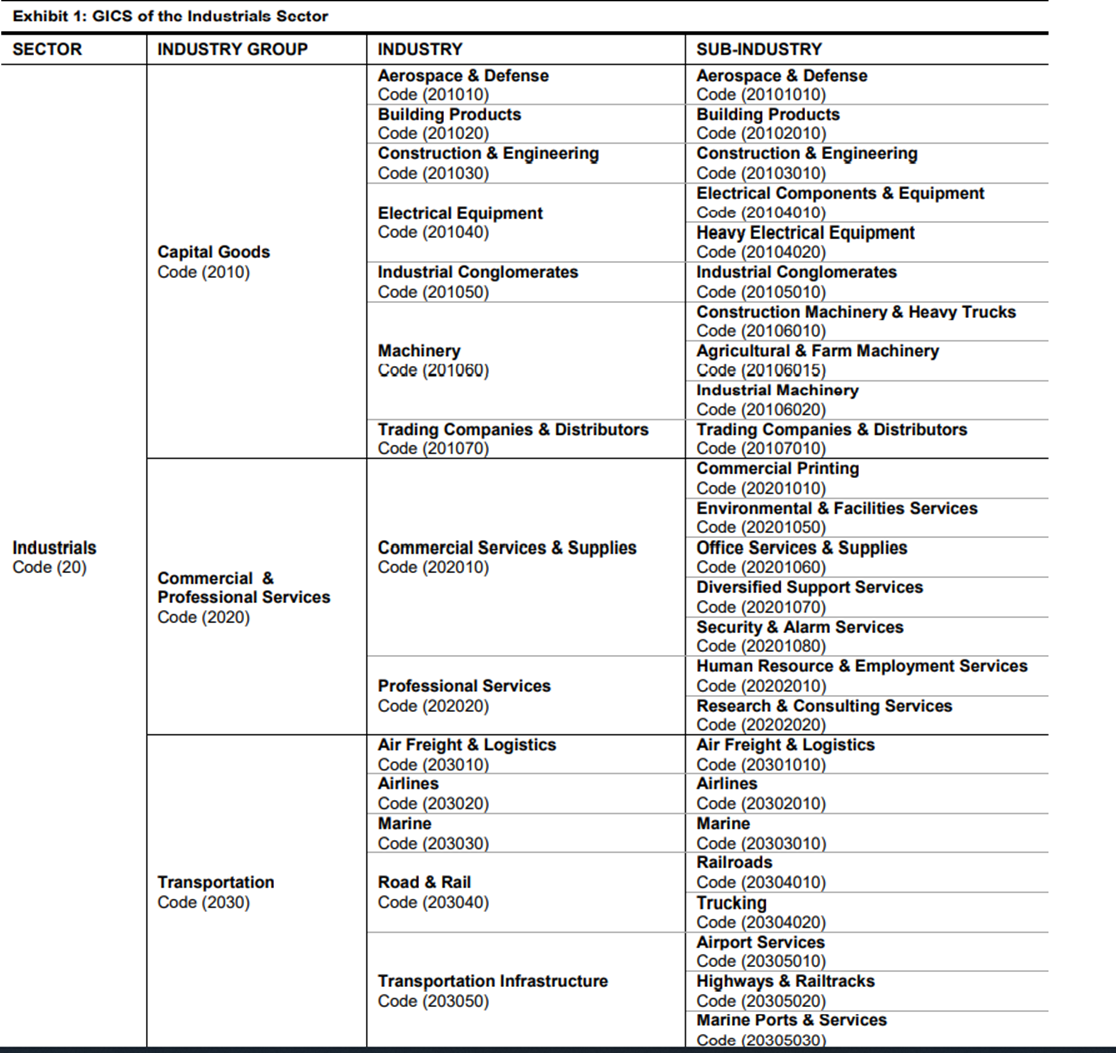
Chart B. XLI is divided into three industry groups (S&P Global)
As you can see, XLI is divided into three industry groups that are themselves divided and subdivided. (Waste management stocks are part of the Commercial Services & Supplies industry, presumably within the Environmental & Facilities Services sub-industry).
The Capital Goods and Transportation industry groups are fairly straightforward. When I read through their subindustries, I can smell metal, fuel, and burnt ozone. But, the Commercial & Professional Services industry group does not sound very “industrial”.
S&P Select Sectors are organized by GICS code, and these codes are based largely on financial criteria by “financial specialists”, so who am I to argue with them? But, I went through the XLI and sorted each of the companies by the older SIC code system and then categorized them according to the Fama-French sector and industry criteria anyway.
Under the Fama-French system, most of the Capital Goods industry group companies are classified as Manufacturing, one of the 12 main sectors. Stocks in the GICS Transportation industry group are categorized as Other by Fama-French, when it comes to the 12 main sectors, but fit very nicely into the Fama-French Transportation industry in the 49-industry data set. The GICS Commercial & Professional Services industry group is largely composed of companies that are considered Business Equipment by Fama-French, essentially tech stocks.
The Fama-French Transportation industry is highly correlated with the Fama-French Manufacturing sector, so it seems to be compatible. As I have shown in my articles on long-term market rotations, however, the Fama-French Business Equipment sector has a mind of its own.
But, how are these industry groups weighted?
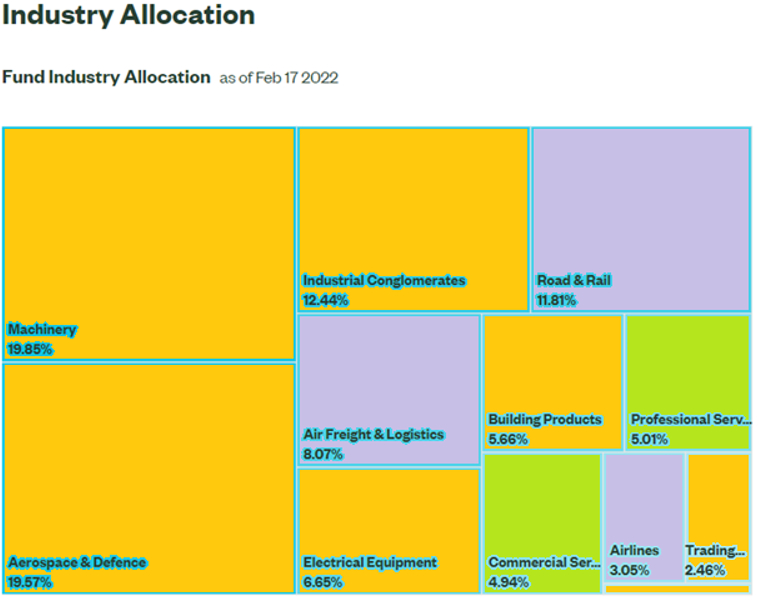
Chart C. Capital Goods industries dominate the XLI (State Street Global Advisors with some modifications by author)
I color coded this chart from State Street Global Advisors to indicate industry group. The orange blocks are Capital Goods, purple Transportation, and green Commercial & Professional Services. The latter industrial group only takes up 10% of the sector, while the Capital Goods group is roughly 67%, leaving around 23% for Transportation.
This seems to have been a consistent pattern, although the Transportation portion has gradually been playing a larger and larger role, as the following graph from S&P Global (linked above) shows.
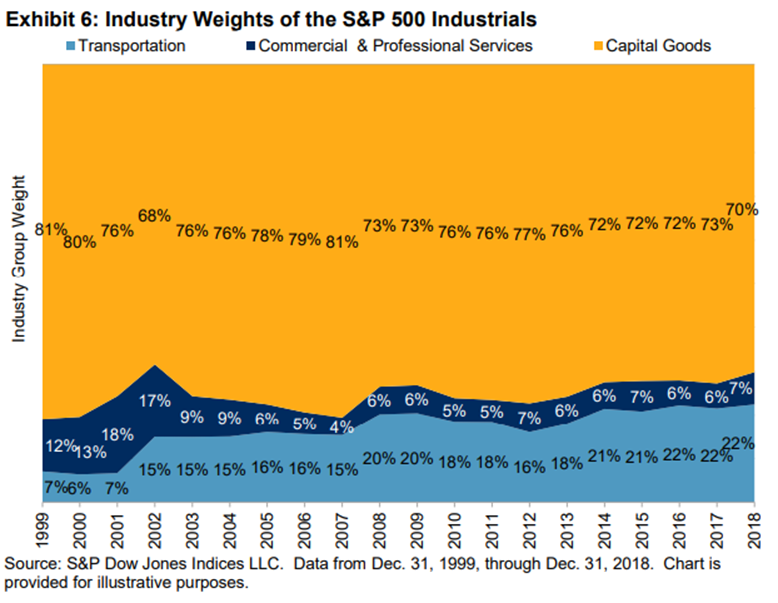
Chart D. XLI has long been dominated by Capital Goods but Transportation has crept upwards (S&P Global)
With that in mind, the following chart suggests that although the tech-like Commercial & Professional Services index (GSPCS) is likely dragging the XLI down a bit after having helped push it higher for so long, the main culprit is the Capital Goods group (GSPIC), the heart of the index (colored in green below).
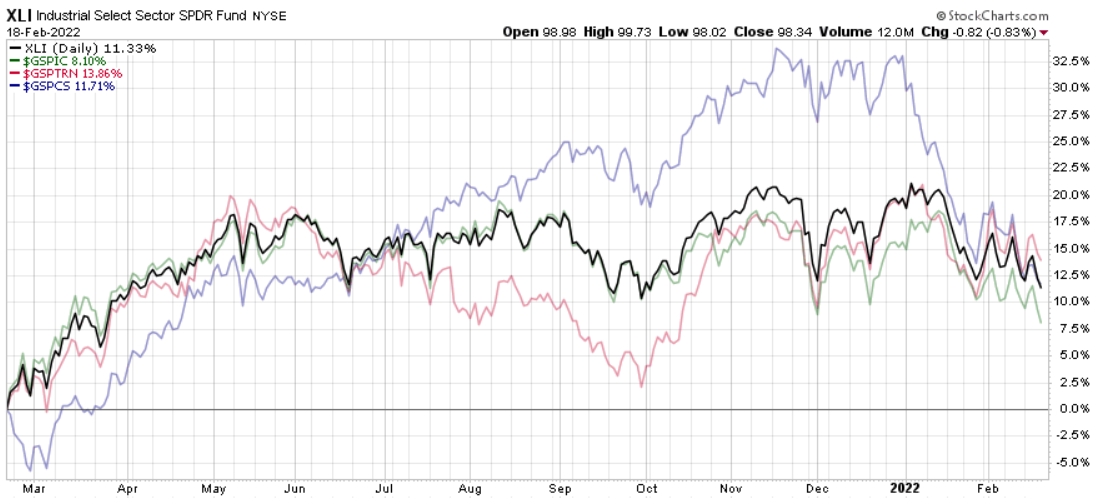
Chart E. All three industry groups have pulled XLI down over the last five weeks (Stockcharts.com)
Transportation (GSPTRN) has also slowed but is providing more lift than the others for the moment.
Prior to writing this piece, I did a preliminary study of the large- and small-cap transportation stocks, and by and large, they are still holding up well technically. If transportation stocks deteriorate further, as I expect they will, I will write up a separate piece for them.
And, under the assumption that the GSPCS services index is a tech or tech-lite index, I will let my previous analysis of that sector stand in for that 10% of the index. It is likely to continue dragging down the XLI.
Capital Goods are the industrial core
But, I want to focus on the real industrial core of the Industrial index, the GSPIC and what it represents. When I run this Capital Goods index through my little algorithm, it, like the parent XLI, flashes ‘sell’. It seems unlikely therefore that the XLI’s increasingly bearish posture is simply an accident of the tech crash, although that does not necessarily mean that the current bearishness will not prove to be temporary.
I want to take a step back to take a longer-term view of this core, but to do that, we need to take a closer look at the components of the XLI and, by extension, the Invesco S&P 500 Equal Weight Industrials ETF (RGI). Both XLI and RGI hold the exact same set of 73 industrial stocks of the S&P 500 but in the XLI, they are cap-weighted while in the RGI, they are, as the name suggests, equal-weighted.
The following table shows the top 70% of XLI’s holdings.
|
XLI holdings as of 17-Feb-2022 |
|||||
|
Name |
Ticker |
Weight |
GICS Sector |
Cumulative Weight |
|
|
Union Pacific Corporation |
UNP |
5.46 |
Road & Rail |
5.46 |
1 |
|
United Parcel Service Inc. Class B |
UPS |
5.20 |
Air Freight & Logistics |
10.67 |
2 |
|
Raytheon Technologies Corporation |
RTX |
4.78 |
Aerospace & Defence |
15.45 |
3 |
|
Honeywell International Inc. |
HON |
4.30 |
Industrial Conglomerates |
19.75 |
4 |
|
Boeing Company |
BA |
4.00 |
Aerospace & Defence |
23.75 |
5 |
|
General Electric Company |
GE |
3.66 |
Industrial Conglomerates |
27.41 |
6 |
|
Deere & Company |
DE |
3.64 |
Machinery |
31.05 |
7 |
|
Caterpillar Inc. |
CAT |
3.57 |
Machinery |
34.61 |
8 |
|
Lockheed Martin Corporation |
LMT |
3.23 |
Aerospace & Defence |
37.84 |
9 |
|
3M Company |
MMM |
2.90 |
Industrial Conglomerates |
40.75 |
10 |
|
CSX Corporation |
CSX |
2.64 |
Road & Rail |
43.38 |
11 |
|
Norfolk Southern Corporation |
NSC |
2.25 |
Road & Rail |
45.63 |
12 |
|
Illinois Tool Works Inc. |
ITW |
2.10 |
Machinery |
47.73 |
13 |
|
Eaton Corp. Plc |
ETN |
2.06 |
Electrical Equipment |
49.79 |
14 |
|
Northrop Grumman Corporation |
NOC |
2.01 |
Aerospace & Defence |
51.80 |
15 |
|
Emerson Electric Co. |
EMR |
1.89 |
Electrical Equipment |
53.69 |
16 |
|
Waste Management Inc. |
WM |
1.86 |
Commercial Services & Supplies |
55.55 |
17 |
|
FedEx Corporation |
FDX |
1.86 |
Air Freight & Logistics |
57.41 |
18 |
|
General Dynamics Corporation |
GD |
1.68 |
Aerospace & Defence |
59.09 |
19 |
|
Johnson Controls International plc |
JCI |
1.58 |
Building Products |
60.67 |
20 |
|
Roper Technologies Inc. |
ROP |
1.57 |
Industrial Conglomerates |
62.24 |
21 |
|
L3Harris Technologies Inc |
LHX |
1.47 |
Aerospace & Defence |
63.70 |
22 |
|
IHS Markit Ltd. |
INFO |
1.46 |
Professional Services |
65.16 |
23 |
|
Parker-Hannifin Corporation |
PH |
1.32 |
Machinery |
66.49 |
24 |
|
Carrier Global Corp. |
CARR |
1.31 |
Building Products |
67.79 |
25 |
|
Trane Technologies plc |
TT |
1.22 |
Building Products |
69.01 |
26 |
|
TransDigm Group Incorporated |
TDG |
1.17 |
Aerospace & Defence |
70.18 |
27 |
Capital Goods & the Fama-French Manufacturing Sector
The only long-term stock data on industrial stocks that I know if is the Fama-French data series (linked to above). When I sort the 73 component stocks of the XLI by Fama-French SIC codes, they generally overlap with the GICS classifications.
Forty-eight percent are classified as Manufacturing, 23% as Transportation, 16% Business Equipment, and 13% other. “Other” here includes companies like 3M, Paccar (PCAR), Jacobs Engineering (J), and Quanta (PWR). In other words, the Fama-French Manufacturing category is somewhat narrower than the GSIC Industrial sector. The defense companies Northrop Grumman and L3Harris are classified as Electronic Equipment (i.e., tech) rather than Manufacturing, for example.
In short, I think the Fama-French Manufacturing category is a fair approximation of the industrial core of the XLI and allows us to put the sector into some historical context.
As for the RGI, the Fama-French data seems to be slightly less useful but still holds up. I did not sum up the current sectoral weights but rather counted the number of stocks by sector/industry. By my count, 41% of the RGI companies are Manufacturing, 23% Business Equipment, 19% Transportation, and 16% other. Nielsen (NLSN), the company behind TV ratings, for example, is classed as Business Equipment along with Northrop Grumman and, in an equal-weighted index, tends to receive similar weighting.
Using (I believe) FactSet classifications, ETFdb.com seems to categorize RGI’s holdings similarly.
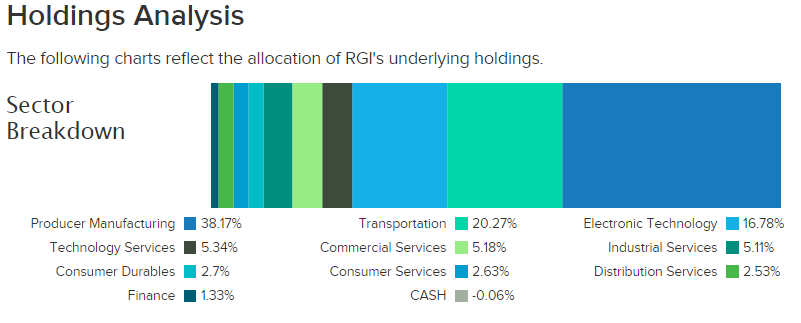
Chart F. RGI has a slightly smaller concentration in cyclicals but a greater emphasis on small-cap themes (ETFdb.com)
So, the sum of this is that the industrial core of the S&P 500 has a slightly smaller representation in the RGI relative to the XLI. If you were to buy RGI rather than XLI, not only are you getting greater exposure (in this environment, risk) to small(er) caps but you are getting slightly more exposure to more service-oriented stocks, which tend to lean more in the direction of the tech sector.
Now, with the prologue past, let’s look at the Fama-French Manufacturing sector.
Historical overview of Manufacturing stocks
My argument is that Manufacturing is highly cyclical, overvalued, “due” for a crash, yet likely to outperform the broader market throughout the rest of the decade.
The chart below shows the price performances of the large-cap Energy and Manufacturing sectors relative to an equal-weighted average of the Fama-French 12 sectors (a good proxy for the S&P Composite).
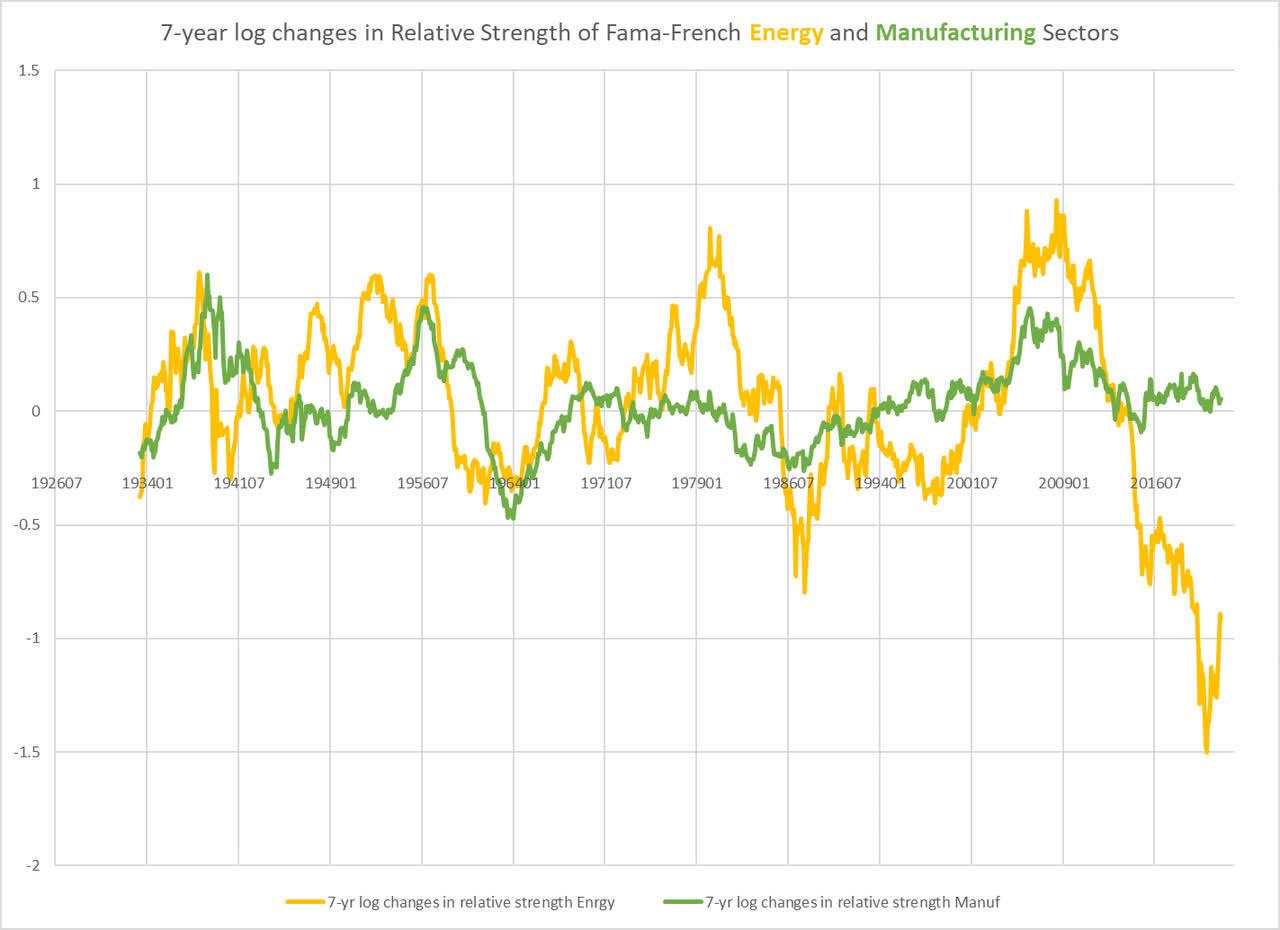
Chart G. Manufacturing stocks tend to track with long-term moves in Energy stocks (Own calculations from Fama-French 12)
I will not repeat the argument I have made elsewhere about energy and long-term sector rotations, except to say that in periods of extreme sectoral dispersions such as we have had in recent years, especially when marked by extreme tech outperformance and energy underperformance, what follows is low returns for the market as a whole, underperformance by tech, and outperformance by energy, whether or not the period tends towards high commodity inflation (as in the 1970s and 2000s) or low inflation (as in the 1930s).
Generally, the Manufacturing sector trends with Energy and other cyclicals like Chemicals, but it is much more closely correlated with the stock market as a whole than is Energy.
If Energy is going to come to dominate the market this decade, which seems likely, Manufacturing ought to do relatively well, as well. But, with nominal returns for the market as a whole likely to be low and possibly negative in the 2020s, Manufacturing stock returns are also likely to be low to negative for the remainder of the decade.
Historical valuations point in the same direction.
Manufacturing stocks are overvalued
In the following two charts, I calculated the implied dividend yields for large- and small-cap Manufacturing stocks back to 1926 and contrasted them with subsequent price returns.
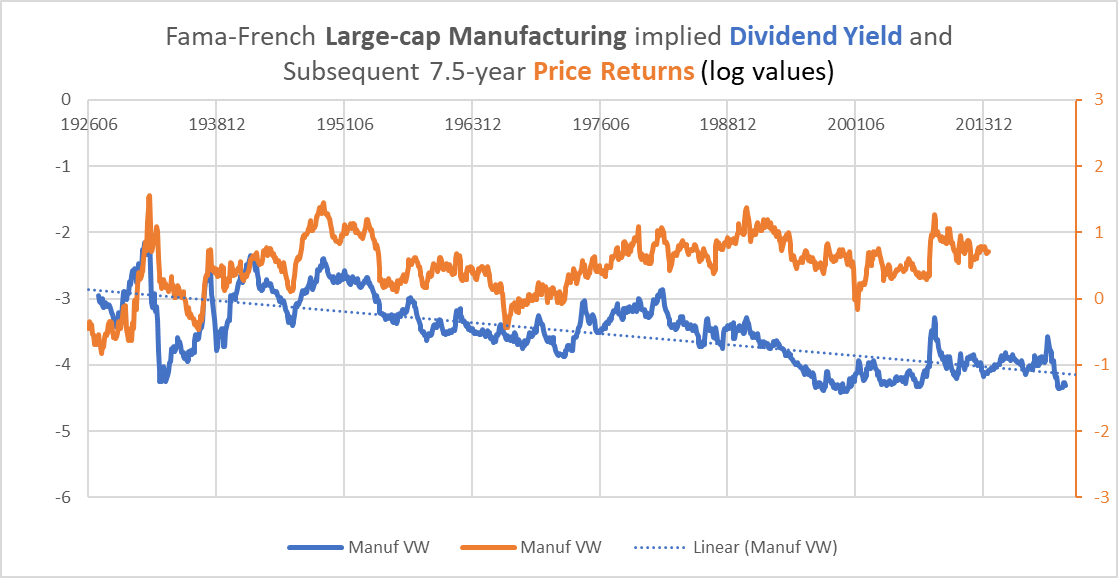
Chart H. Dividend yields have been good predictors of future performance (Own calculations from Fama-French)
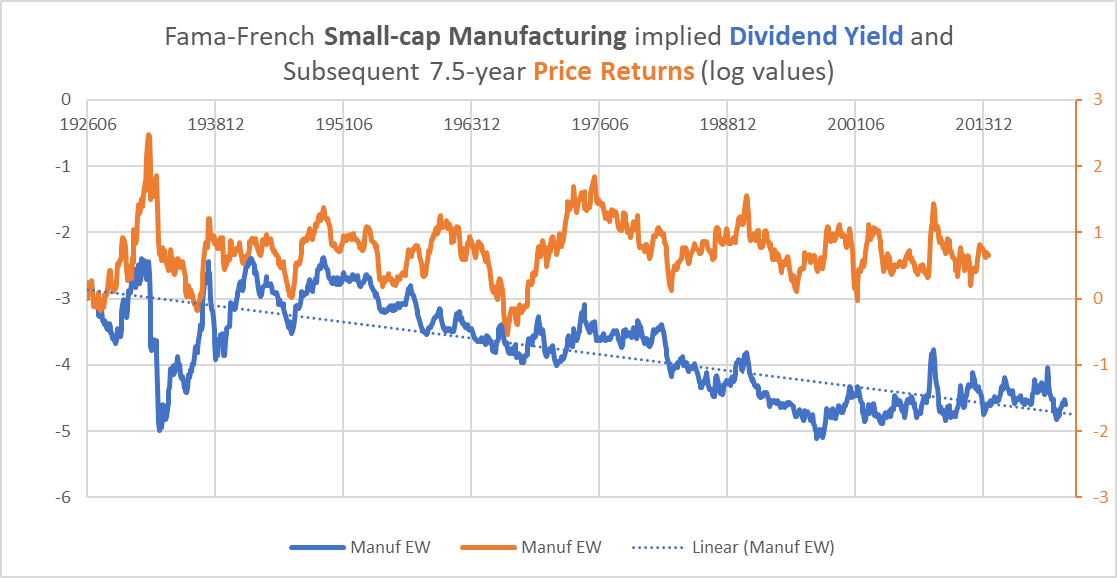
Chart I. Small-cap dividend yields have also been predictive (Own calculations from Fama-French)
Yields are near historic lows. These charts are log values, but the arithmetic values are 1.33% and 1.01% for large- and small-caps, respectively.
Seeking Alpha places the dividend yields for XLI and RGI at similarly low values. The Invesco S&P SmallCap Industrials ETF (PSCI) is also included here.
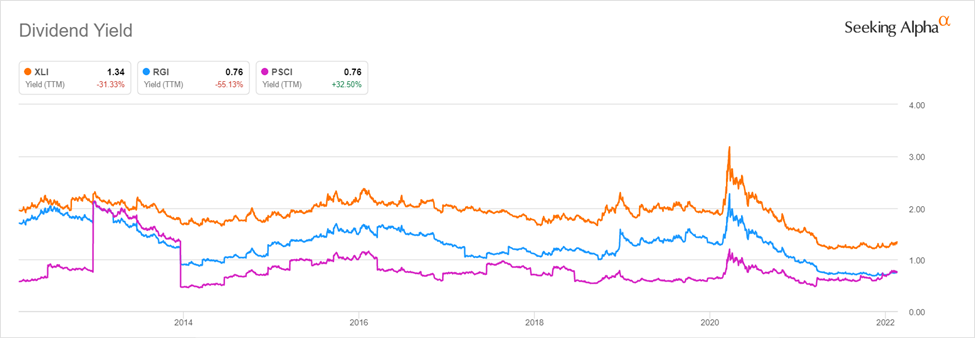
Chart J. Dividend yields remain near historic lows, although falling prices are pushing them up slightly (Seeking Alpha)
Using dividend yields as proxies for valuations like PE ratios is difficult because dividend payout ratios have fallen over the last 60-70 years. Using them as signals for future returns is further complicated by the breakdown in the predictive powers of the PEG ratio due to the persistently high returns of the last 30 years.
Price returns, and especially total returns, are highly correlated with detrended yields, but if we use detrended yields, it is hard to tell whether current yields are high or low. Small-cap yields are, for example, ‘above trend’ in Chart I above. But, within the full context of the market, these yields are likely near their bottoms. Although a cyclical crash could drive dividends (and by extension the dividend yield) to very low levels, the super-secular disconnect between price and fundamentals is likely ending.
To put this another way, the detrended yield is a useful tool for looking at the relationship between medium-term returns (in this case, 7.5-year returns) but does not tell us whether yields are high or low on a longer timeframe. For that, we need the help of PE ratios.
Although there is no way to be sure what long-term historical PE ratios for the sectors were, both the high correlation Manufacturing stocks have had with the market as a whole and the PE ratios of the last 14 years suggest that the sector’s valuations are at levels as unsustainable as the S&P 500’s.
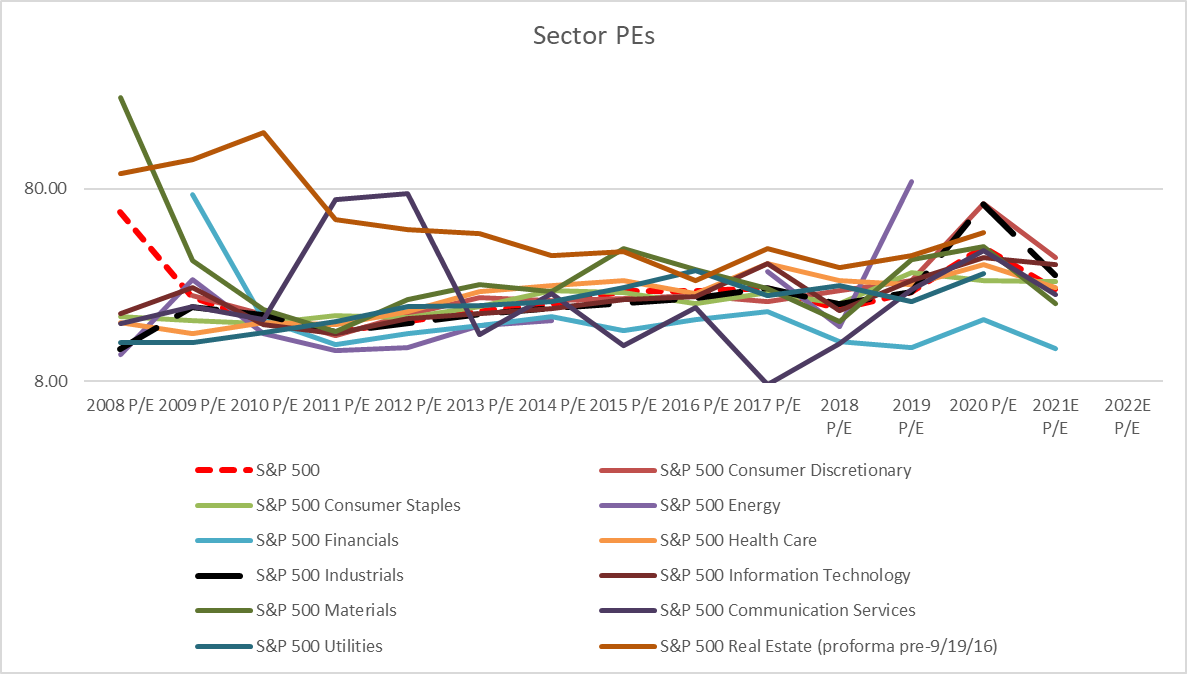
Chart K. XLI’s PE ratio has been roughly in line with the S&P 500’s (S&P Global)
If the industrials PE is hard to pick out in this chart, it is because most sectors are concentrated at roughly similar values, with a few sectors (information tech, financials, energy) on the fringes. The industrial sector’s PE ratio has closely tracked the S&P 500’s since 2009 but was higher in 2021 than the latter’s (28 vs 24 for the S&P).
This suggests that the current low dividend yields not only reflect falling dividend payout ratios but high valuations.
Industrial cycles and stock market crashes
As I argued at the beginning, the rotation from tech and high market-wide returns to energy and cyclicals and low returns is likely to be hurried along by a cyclical collapse. And, in the equity space, Manufacturing/Industrials is the place to look for evidence of that.
In previous articles, I have argued that history suggests a cyclical collapse is first and foremost a collapse in earnings growth and secondarily a collapse in industrial metals. Interest rates and other non-precious metals commodities are last. But, Manufacturing return cycles have been almost as highly correlated with S&P Composite earnings as have industrial metals, and they are more highly correlated with earnings cycles than are the other Fama-French sectors.
The following chart shows the relationship between large- and small-cap cycles and S&P earnings cycles (cycles measured as the log change over a 36-month moving average).
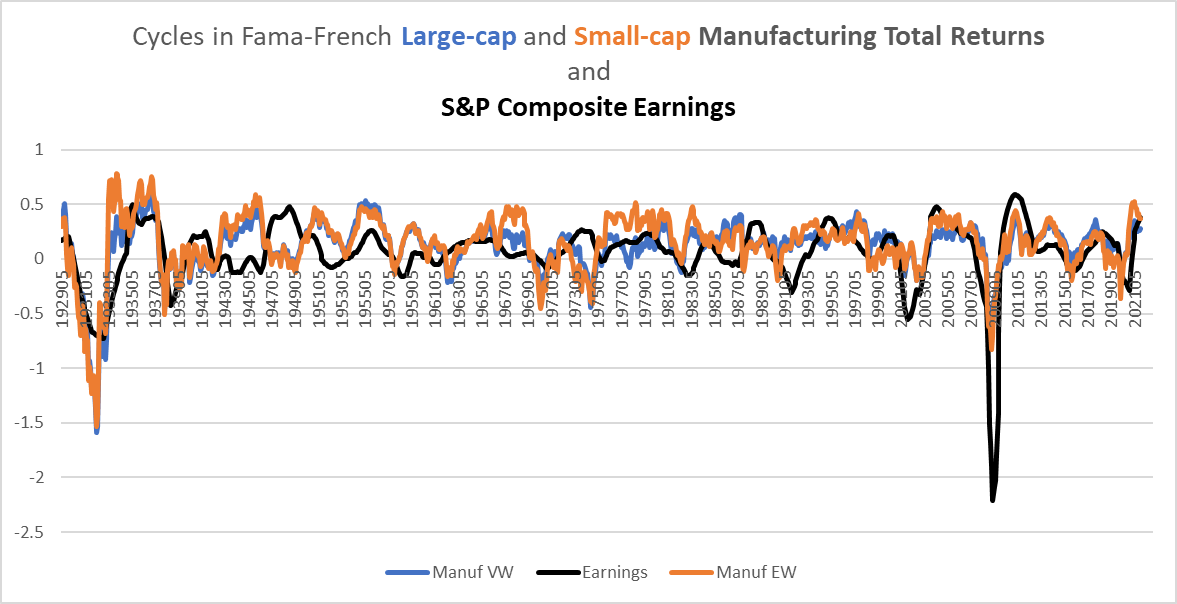
Chart L. Cycles in Manufacturing stocks have tended to correlate with the broader market’s earnings cycle (Own calculations from Fama-French and Shiller)
The correlations have been especially tight over the last twenty years. It appears that there is even a slight lag in the earnings cycle.
Just because the earnings cycle turns down, it does not mean a crash is coming. A host of other conditions have historically been necessary for a cyclical downturn to turn into a crash. Short-term spikes in energy prices (and fertilizer prices, it seems), transitions in the long-term trend of energy prices, and high long-term sectoral dispersions are among them, and we have extreme levels in each of those categories. High valuations also make for a nice accelerant.
It is under these conditions that cyclical downturns become “crashes”, and identifying a downturn helps avoid major losses.
Recent price action in key industries
The slowdown in XLI and the core GSPIC series in this chart, visible also in the rate of change in Chart L, suggests that unless these stocks turn around quickly, the upswing of the cycle is coming to a close, and within the context described above, a crash is looming.

Chart M. The industrial cycle is peaking (Stockcharts.com)
This is apparent in RGI and PSCI, as well, especially as the latter dances on its 52-week lows like a cat on a hot tin roof.
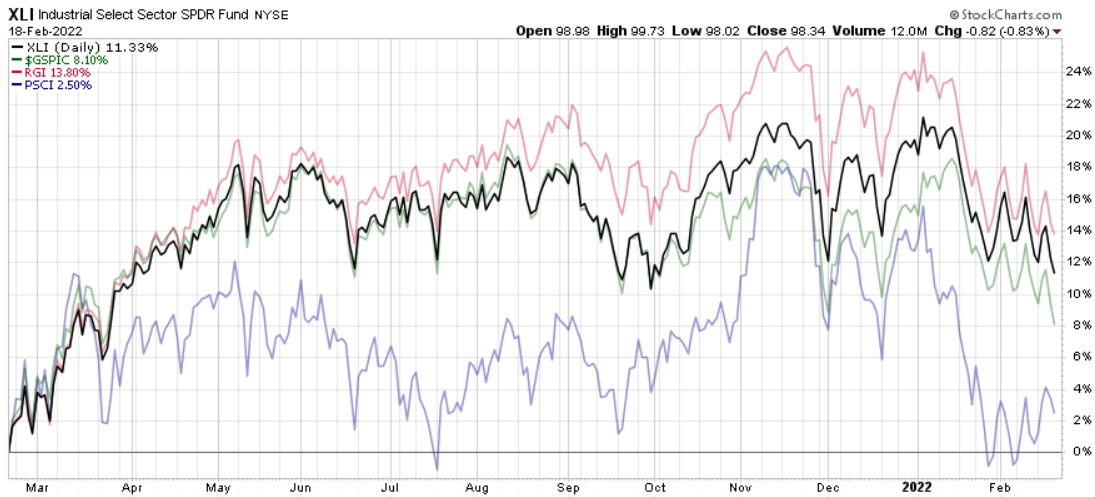
Chart N. Small-cap industrials are already at 52-week lows (Stockcharts.com)
We can further break the Capital Goods industrial group (GSPIC) down into component industries, as in the following chart.
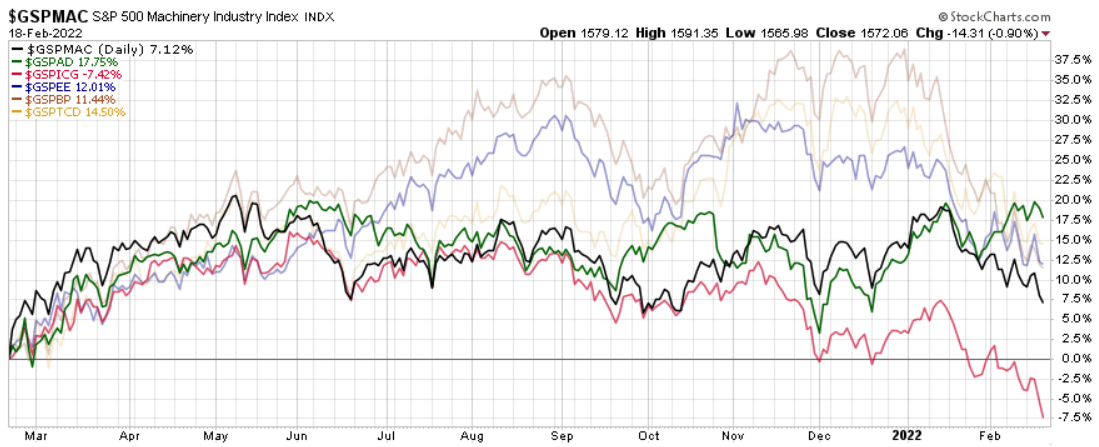
Chart O. Only Aerospace & Defense is showing any strength at the moment (Stockcharts.com)
I have ranked them in order of the weighting they are attributed in the table of XLI holdings presented earlier in the article.
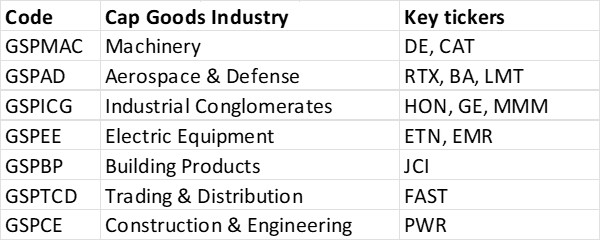
Chart P. Capital goods industries ranked by XLI weighting (Own calculations from S&P Global)
The good news is that the industrial conglomerates are some of the least cyclical of the Capital Goods industries, so they may not be the canary in the coalmine. But, many of the other industries are quite cyclical and they are fast approaching their 52-week lows. Machinery stocks, for example, are at the core of the core, and they have been unable to breakout of their range of the last year. Recent weakness in CAT is certainly contributing. Corey Cramer wrote a very nice article on how cyclicality plays out in these kinds of highly cyclical stocks and how difficult it is to use traditional metrics to investment in these companies.
Conclusion
What causes these cycles to turn? Rising interest rates or too hot commodity prices or hot inflation generally or, in this cycle, supply chain problems or lack of capex spending among commodity producers or geopolitical uncertainty? Sure, if you like. Perhaps if half of these were cleared up by the end of the month, markets would rally, but the imbalances that exist in the market took years and, in some cases, decades to build up. I think history suggests that as these long-term imbalances accumulate, they sow the cyclical seeds of their own destruction. And the easing of market imbalances-perhaps this is true of imbalances in nature generally-is rarely achieved in an orderly fashion.
Perhaps this cyclical downturn will prove to be more benign than I am making it out to be here, but the risk of such a collapse, not only a cyclical crash but an extended period of very low returns, is high and rising. Shifting to more defensive sectors like staples, utilities, and Treasuries (TLT) (ZROZ) would probably buy time and help reduce the risk of perhaps quite sizeable and effectively irreversible losses.
[ad_2]
Source links Google News

