[ad_1]

Shutter2U/iStock via Getty Images
This earnings season appeared to be the one rife with the precedents of swift and ruthless wringing out of the valuation excesses, as I observe.
The environment where the outlook for growth stocks is clouded by higher interest rates that might go up well quicker than initially anticipated is highly flammable. The market is struggling to interpret the data being released, without too many musings pushing stock prices steeply lower when financials surprise to the downside.
The Amplify Online Retail ETF (IBUY) is one of the growth-focused exchange-traded funds that have been bearing the brunt, with an over 21% price decline YTD.
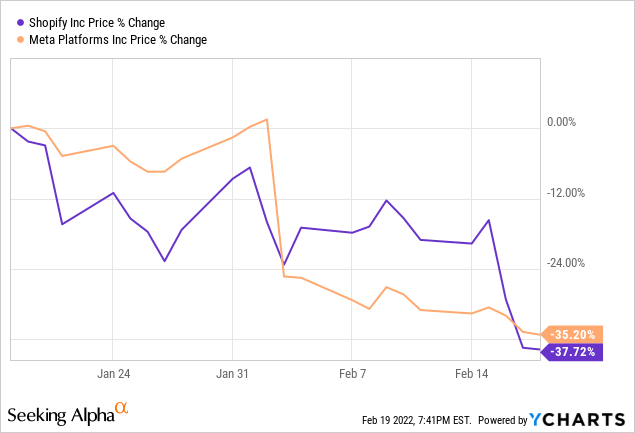
IBUY is a mix of the pandemic champs that have seen their market values surging thanks to buying patterns shifted due to the lockdowns which supercharged the rise of e-commerce. Now, most are in a tailspin, with Shopify (SHOP) being the vivid example, with yet another Meta (FB) moment this year, though with a less devastating price decline in absolute terms. Yet the soft guidance has effectively shed almost 20% off SHOP’s price in less than a week.
Certainly, a contrarian argument can be made here that the long-term trends shaping e-commerce are in place, thus a rare buying opportunity has emerged. No doubt, there is always a rationale behind contrarian optimism, but I would opt for a neutral stance.
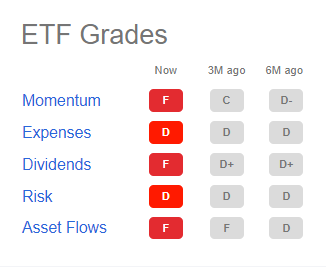
First, the scale of the problem can be sensed immediately upon looking at the ETF grades summary: it is all red. The combination is rather gloomy, as IBUY is an expensive (the 65 bps ER), no-dividend, risky fund with worrisome asset flows trends and simply bleak performance.
Seeking Alpha
And second, though promising at first glance, investing in an online retail portfolio means being overexposed to expensive and low-profitability stocks. Thus, I believe it is better to remain on the sidelines.
Investment strategy
IBUY tracks the smart-beta EQM Online Retail Index. In essence, the benchmark has a relatively broad approach allowing both developed and emerging market equities (depending on a few liquidity and accessibility considerations) to compete for the place in it if their market values are north of $300 million.
A constituent must generate no less than 70% of sales from “traditional online retail, online travel, or online marketplace activities.” Heavyweights that generate less than 70%, though at least $100 billion are also given the green light.
To avoid being over-relied on just a handful of most generously valued companies, the index uses a modified equal weighting. More specifically, the index provider is content with non-U.S. equities qualifying for inclusion, with one caveat: U.S. stocks that are grouped in pool one are assigned no less than 75% total weight. That’s an interesting approach to minimizing FX risks, I would say. Foreign equities are in pool two, where they are weighted equally, precisely like their U.S. counterparts within their cohort.
Weights are being reassessed upon biannual rebalancing.
An index that is tracked by the ProShares Online Retail ETF (ONLN), IBUY’s closest peer, has a somewhat similar approach, assigning ex-U.S. stocks only 25% combined weight, while also banning companies with market values below $500 million. The principal difference is that since the market-cap ingredient is also in the mix, ONLN’s portfolio is extremely top-heavy, with Amazon (AMZN) accounting for more than a quarter of the net assets (~26.4% in the index as of February 18). The Amplify ETF does not have that flaw, with AMZN in 5th place (~2.5% weight) and the top ten holdings having around 26% share.
Another peer, the Global X E-commerce ETF (EBIZ), tracks the Solactive E-commerce Index, which also uses a modified market-cap weighting, though with a 4%/0.3% cap to avoid top-heaviness.
Returns the strategy was capable of delivering
IBUY delivered clearly astronomic gains in the past, but over limited timeframes, with the little-to-no possibility of replicating such an outstanding performance going forward.
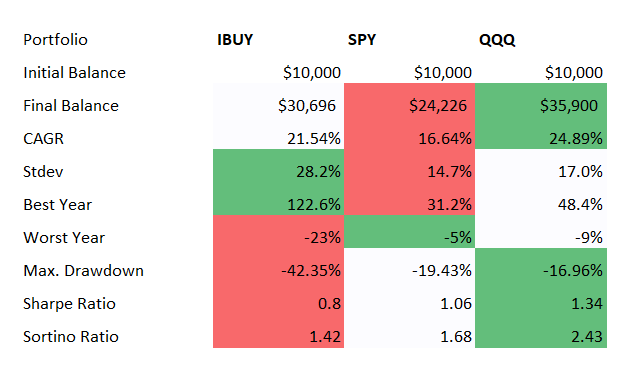
First, let us compare its returns to the S&P 500 ETF (SPY) and the Nasdaq 100 tracked by the Invesco QQQ ETF (QQQ). The period in focus stretches from May 2016 (IBUY was incepted in April 2016) to January 2022.
Created by the author using data from Portfolio Visualizer
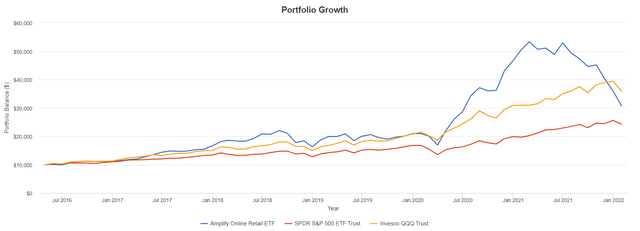
IBUY did beat SPY, but with a higher standard deviation and elevated risk to boot. QQQ’s results were more attractive, with the CAGR higher by more than 3% and the perfect Sortino ratio above 2.
Portfolio Visualizer
Quite clearly, the phenomenal alpha supercharged by 2020 was gradually becoming slimmer during 2021 before evaporating completely in 2022.
To bring a bit more color, the next chart shows SPY, QQQ, and IBUY performance this year. As usual, the Invesco S&P 500 Pure Value ETF (RPV) was added for better context.
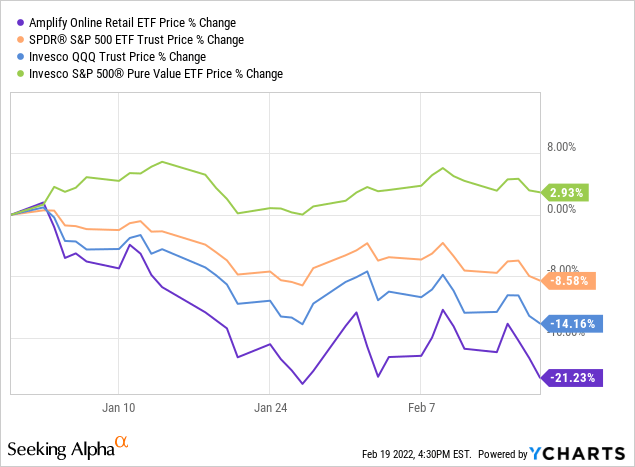
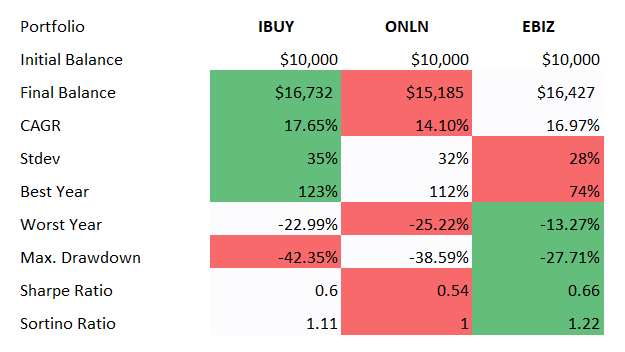
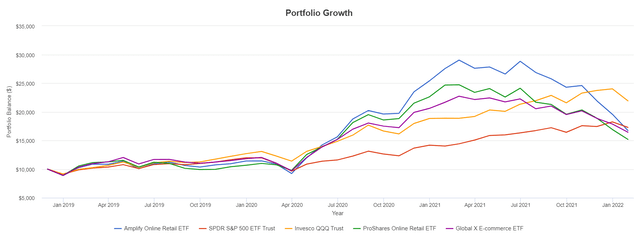
Next, the group of the closest peers, with the above-mentioned ONLN and EBIZ. The period analyzed is much shorter, December 2018 – January 2022, owing to EBIZ incepted in November 2018.
Created by the author using data from Portfolio Visualizer
Despite having a higher expense ratio of 65 bps vs. EBIZ’s 50 bps and ONLN’s 58 bps, the fund outperformed both, though with a higher standard deviation.
Anyway, the trio still underperformed SPY and QQQ, with the softness of the opening weeks of 2022 to blame.
Portfolio Visualizer
With such a steep decline from an all-time high, did a contrarian opportunity emerge? Let us assess a few factors.
Holdings
As of February 19, IBUY managed a portfolio of 79 stocks, with Expedia (EXPE) being its key holding with ~3.5% weight.
Expectedly, most are U.S. companies, close to 75% as of end-2021 as shown on the fund’s website, with China in second place with 6.5% weight. Alibaba (BABA) certainly can be found in the mix, though with only ~0.8% weight. Among other EM stocks is Ozon (OZON), a Russian internet retailer with the Nasdaq-quoted ADS.
All the three echelons of the stock market are present, with numerous small-caps like Groupon (GRPN), large-caps like eBay (EBAY), and over $1 trillion titans like AMZN.
Now, factors. The key consideration for a contrarian thesis is that valuation is more or less adequate, without an intolerable risk of the further shrinkage of multiples. The Quant data will help us to assess that.
~80% of IBUY’s holdings have a Quant rating (I adjusted to tickers this time), and only 14% sport value characteristics (a Valuation grade of B- or better). 51% of the portfolio is valued terribly (D+ grades at best), and that is even despite the e-commerce multiples gradually correcting in 2021 and this year. So the room for further decline remains large. Interestingly, exposure to the growth factor is significant, though not ideal: just ~35%.
Next, IBUY clearly has a quality problem.
With 34% of stocks having Profitability grades of D+ and worse (almost the same share have robust profits), the fund does not look like a quality investor’s safe haven.
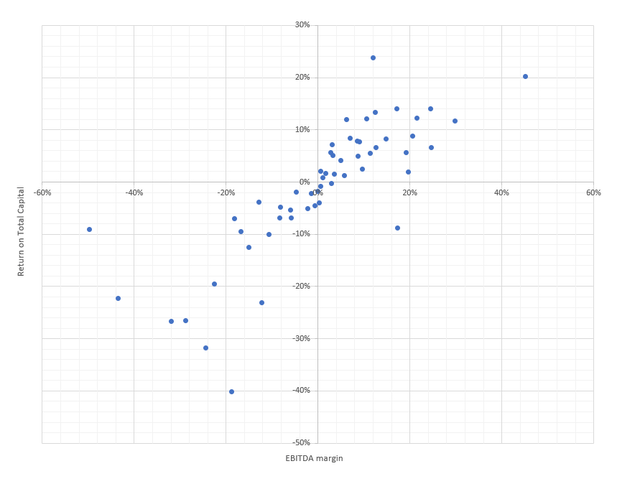
Digging deeper, the chart below summarizes Returns on Total Capital and EBITDA margins for ~80% of the holdings.
Created by the author using data from Seeking Alpha and the fund
Though there are tremendously profitable businesses in the mix, like Copart (CPRT), which is in the upper right corner with an ROTC of 20%, most score rather poorly, unable to eke out even measly EBITDA.
I intentionally removed Jumia Technologies (JMIA) and ContextLogic (WISH) to improve the readability of the chart. The two have horrible results, with the EBITDA margin/ROTC of -120%/-31% and -31%/-121%, respectively.
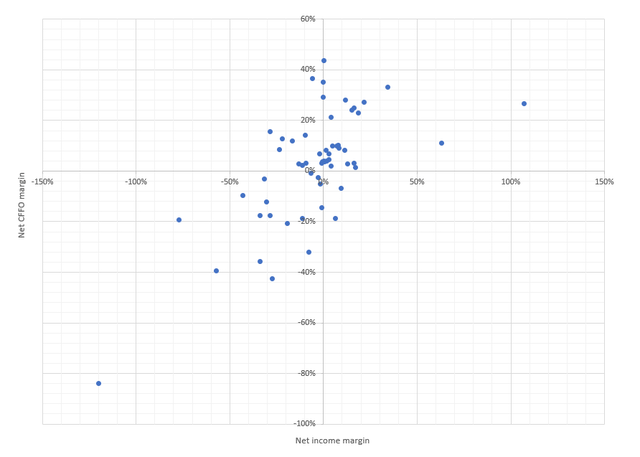
The next chart combines the cash flow and net income margins.
Created by the author using data from Seeking Alpha and the fund
The picture is rather pessimistic again as close to 22% of companies outspent cash flows (hence, were also unable to cover capex) and ~32% are unprofitable.
Final thoughts
The pandemic has created a buoyant environment for online retail players, accelerating the trends that have been gaining momentum for years. With it seemingly abating and investors rotating out of growth stocks, IBUY becomes much riskier than before.
The long-term thesis relying on the premise that online retail will continue dominating is of course valid. The issue is that a too-quick expansion was priced in, while quality is precarious. In sum, it is better to remain on the sidelines.
[ad_2]
Source links Google News

