[ad_1]
Pgiam/iStock via Getty Images
Investing Thesis
Advancing information technology has modified stock market economics to the point where trade-transaction “commission” costs are so trivial on internet-placed orders that competition now has ended them. Pity not the broker’s firm, still surviving immodestly on high-volume trades demanded by institutional investors skillfully managing multi-billion-$ portfolios daily.
The necessary smoothing out of irregular big, one-sided transactions is the Market-Makers’ assignment, carried out as described in the bullets above. That process provides an insight into the uneven skills present in the institutional money-management trades, where now (unshared) forecasts exist defining realistic (evolving) expectations of coming price changes, stock by stock – or ETF.
Multi-year histories exist of those forecasts, and the subsequent actual market prices they projected, so useful scores are present to guide us to the more reliable resources. That is what is presented on many Leveraged-Long ETFs in this article.
Rewards vs. Risks in comparisons of Leveraged ETFs
Figure 1
blockdesk.com
(used with permission)
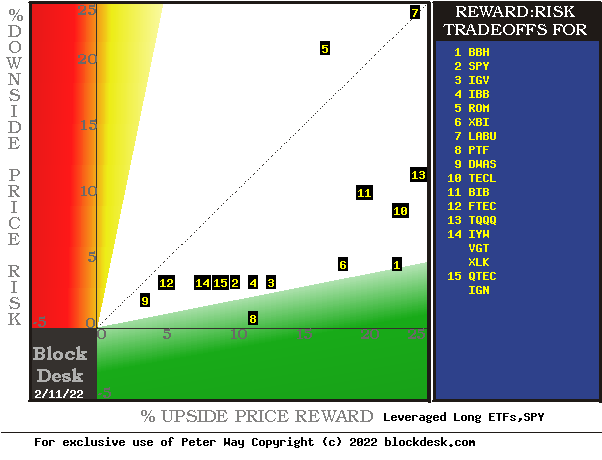
The tradeoffs here are between near-term upside price gains (green horizontal scale) seen worth protecting against by Market-Makers with short positions in each of the stocks, and the prior actual price drawdowns experienced during holdings of those stocks (red vertical scale). Both scales are of percent change from zero to 25%.
The intersection of those coordinates by the numbered positions are identified by the stock symbols in the blue field to the right.
The dotted diagonal line marks the points of equal upside price change forecasts derived from Market-Maker [MM] hedging actions, and the actual worst-case price drawdowns from positions that could have been taken following prior MM forecasts like today’s.
The common theme of these ETFs is their involvement with high technology industries.
Our principal interest is in TECL at location [10]. ETFs on the reward~risk tradeoff “frontier” are DWAS at [9], others at {14], [15] and a “market index” norm of Reward~Risk tradeoffs offered by SPY at [2], IBB at [4] and IGV at [3], BBH at [1] and TQQQ at [13]. Best locations for stocks likely to provide capital gains in the near-future are in directions down and to the right.
Those forecasts are implied by the self-protective behaviors of MMs who must usually put firm capital at temporary risk to balance buyer and seller interests in helping big-money portfolio managers make volume adjustments to multi-billion-dollar portfolios. Their protective hedging actions using derivative securities in open markets define daily the extent of likely expected price changes for thousands of stocks and ETFs.
This map is a good starting point, but it can only cover some of the investment characteristics which often should influence an investor’s choice of where to put his/her capital to work. The table in Figure 2 covers the above considerations and several others.
Principal questions for all alternatives are “how likely are these outcomes to happen,” and “can their impact be improved?”
Comparing Alternative Investments
Figure 2
blockdesk.com
used with permission
Figure 2 presents the MMs’ price range forecasts [B] to [C] for the alternative investment candidates in Figure 1, along with the outcomes [ I ] from their prior past 5 years of daily forecasts with the same proportions [G] of today’s up-to-down Range Index prospects.
Contributing to that comparison are the demonstrated odds of profit-successful forecasts in column [H], its complement of 100 – H, or loss frequency, size of net gain attained [I] and size of worst loss [F] experienced in prior holding periods, so that, when weighted appropriately in [O] and [P], they produce the Net of [Q]. Respecting the power of compounding, [Q] converted into basis points per day [J] of capital commitment at [R] presents a highly comparable figure of merit (fom) for investing preferences where the dominant objective is to build easily liquidated capital to meet emergency, retirement or other planned needs.
By its use as a ranking, the figure of merit (fom) [R] for each row provides an additional measure of attraction, emphasizing the capital gain potential for ROM. Since the [H] odds on wins vs. losses and the [J] holding periods impact [R], the size of samples from which past outcomes are drawn need careful scrutiny but are comparable for all types of equity investments.
In the course of evaluation the sample size [L] of prior forecasts similar to today’s is inadequate in the pink cells with fewer than 20 experiences. Other deficiencies are noted in pink where [S] size of forecast price ranges is too small to be useful, and in [T] Reward to Risk ratios are at a disadvantage rather than a benefit.
Note also please the comparison of these stocks with the S&P500 index-tracking ETF (SPY) and with the 3302 securities average for which we here compile forecast population specifics. From that population we use the dimensions illustrated in Figure 2 to rank the most promising and historically evidenced few stocks at present, each based on prior MM forecasts with upside-to-downside balances like today’s.
Recent Trends in TECL Forecasts by Market-Makers
Recent strength in TECL stock price apparently has attracted attention among some institutional investment organizations. In the last two days their buy orders have supported decreased expectations of coming prices.
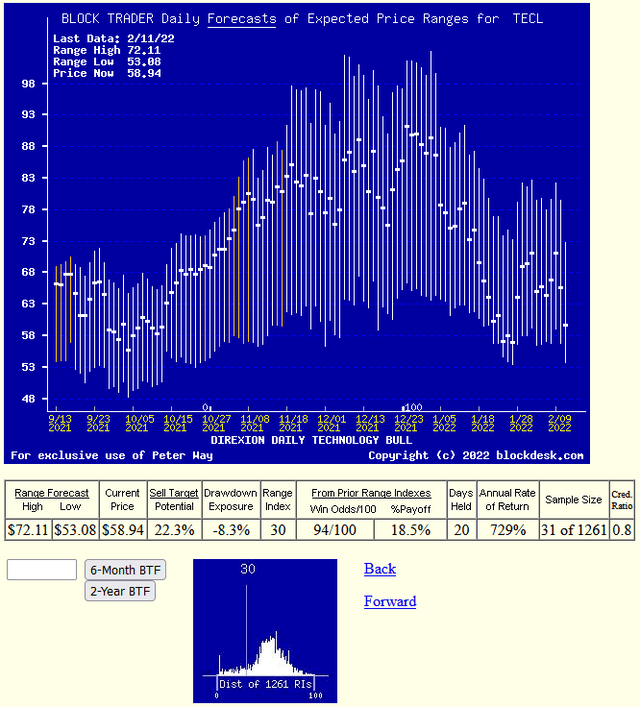
Figure 3 shows the MM price range forecasts of coming events as vertical lines, not to be confused with “technical analysis” pictures of what has happened in the past. Each forecast range is split into upside and downside price change prospects by the closing price on the day of the forecast.
The current upside target of $72 offers a prospective gain of +22%, but its current price of $59 is in the lower third of market professionals’ expectations of from $53 to $71.
Figure 3
blockdesk.com
(used with permission)
The small “thumbnail” picture at the bottom of Figure 3 shows the frequency of the past 5 years of TECL daily Range Indexes [RI]. At its present level of 30 most of subsequent RIs, and their prices, clearly have been higher. In the past there have been 31 out of the 1261 daily forecasts with RIs of 30.
Nearly all of the 31 have reached their top-of-range forecasts, so the historic odds of reaching past targets has been 94 out of 100. And their average payoff was +18.5% in only 20 market days (4 weeks) of capital commitment to the venture – an over 700% a year rate. No guarantees, just good odds for a big payoff rate by being an active investor, taking gains when they have been presented as expected.
Conclusion
Direxion Daily Technology Bull 3x Shares ETF (TECL), in comparison with dozens of other Leveraged Long ETFs of special-character stocks, appears on a number of bases to be a best choice for near-term capital gain at a prompt rate.
[ad_2]
Source links Google News

