[ad_1]

Sezeryadigar/E+ via Getty Images
Investment Thesis
Dividend ETFs are a popular income source for investors who are seeking a regular stream of cash. It is common for dividend ETFs to have a lower beta, because a dividend generally shows that a company is financially healthy enough, thus the investment is seen as less risky by market participants. Investors also appreciate that dividend ETFs offer more control over their money, and perceive them as offering a way to address the effects of inflation because the payouts are made regularly. However, in some unfortunate situations, the company can turn out to be a dividend trap that lures investors by providing a high yield. Another drawback of dividend investing is the price performance of dividend-paying stocks over long periods of time. As they tend to reward shareholders through dividends, these companies generally invest less in future growth opportunities and therefore have a hard time outperforming the market. In this article, I will review the Global X SuperDividend U.S. ETF (NYSEARCA:DIV), which provides exposure to a basket of high dividend-yielding equities in the US.
Strategy Details
The Global X SuperDividend U.S. ETF tracks the performance of the Indxx SuperDividend U.S. Low Volatility Index. This index invests in 50 of the highest dividend-yielding equity securities in the United States. This strategy seeks to provide monthly dividend distributions. DIV has made monthly distributions for 8 years running. Lastly, DIV screens for equities that have exhibited low betas relative to the S&P 500 in an effort to produce low volatility returns.
If you want to learn more about the strategy, please click here.
Portfolio Composition
From the sector allocation chart below, we can see the index places a high weight on consumer staples (representing around 24% of the index), followed by utilities (accounting for 15.40% of the index) and industrials (representing around 12.% of the fund). The largest three sectors have a combined allocation of approximately 51.80%. All in all, I like the fact that DIV is pretty well-diversified across sectors. In terms of geographical allocation, DIV invests in US equities only.

Global X ETFs
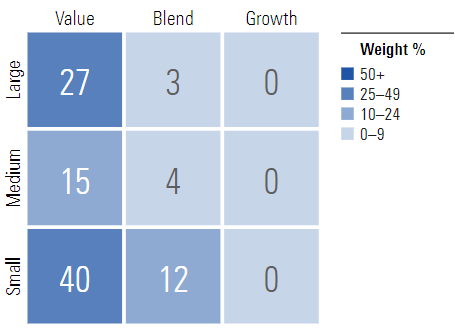
DIV invests over 40% of the funds into small-cap value issuers, characterized as small-sized companies where value characteristics predominate. Small-cap issuers are generally defined as companies with a market capitalization below $2 billion. The second-largest allocation is in large-cap value equities. It is interesting to see that DIV allocates approximately 82% to value stocks that generally generate excess cash and are therefore capable of returning capital to shareholders. I like the fact that more than 50% of the portfolio is invested in small caps, which generally tend to outperform large caps over the long term.

Morningstar
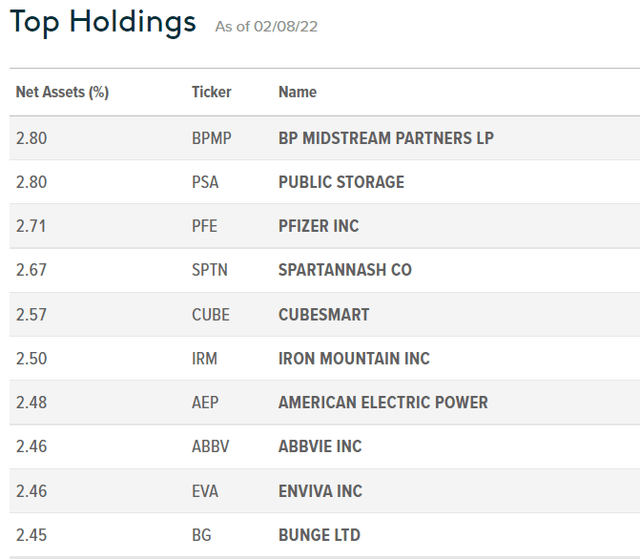
The fund is currently invested in 50 different stocks. DIV is very well-diversified across issuers. The top ten holdings account for 25.90% of the portfolio, with no single stock weighting more than 3%.

Global X ETFs
Since we are dealing with equities, one important characteristic is the portfolio’s valuation. According to Global X ETFs, the fund currently trades at an average price-to-book ratio of 2.14 and at an average price-to-earnings ratio of 13.41. In addition to that, the portfolio has a return on equity of 16.40%. I like the fact that DIV offers exposure to a basket of cheap stocks that have on average a good return on equity. However, valuation is not the only driver of future returns. I believe the quality of issuers is an equally important factor in determining future returns.
Is This ETF Right for Me?
DIV has a distribution rate of 5.8%. Given the relatively high dividend yield when compared to a plain vanilla S&P 500 ETF, this ETF is suitable for the dividend investor looking for a monthly source of income. That said, you should keep an eye on the dividend growth history, which clearly shows a negative trend since 2016. As a dividend investor, the last thing you want is your monthly dividend payment to start shrinking.

Seeking Alpha
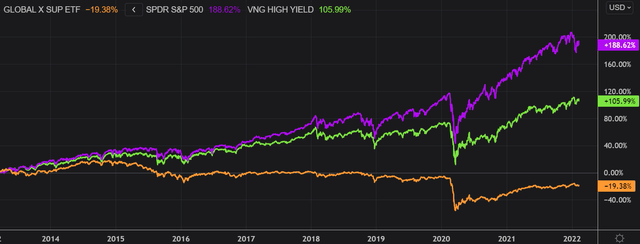
I have compared below the price performance of DIV against the price performance of the SPDR S&P 500 Trust ETF (NYSEARCA:SPY) and the Vanguard High Dividend Yield ETF (NYSEARCA:VYM) over 5 years to assess which one was a better investment. Over that period, DIV underperformed both strategies. DIV underperformed SPY by a 75 percentage points margin, which means you would have been better off buying the S&P 500 index even if it offered a lower yield. To put DIV’s performance into perspective, a $100 investment in DIV five years ago would now be worth $80.56, excluding dividends. This represents a compound annual growth rate of -4.23%, which is a horrible return in one of the greatest bull markets in US history.

Refinitiv Eikon
If we take a step back and look at the performance of the strategy from a 9-point view, the results don’t change much. In the below chart, we can see the S&P 500 clearly outperformed DIV. I am personally concerned by DIV’s lack of capital appreciation over such a long period of time. Even if you end up having a positive return after 9 years if you factor in dividends, the price performance is clearly a drag on the total return. That cannot be said about VYM, which shows that you can both have a decent dividend yield and generate capital gains.

Refinitiv Eikon
Key Takeaways
In summary, DIV provides exposure to a basket of high dividend-yielding equities in the US. This ETF is very well diversified, both across sectors and issuers, and can be used to generate a steady stream of income. I would personally keep an eye on the dividend growth going forward to make sure the strategy keeps a stable dividend amount. I’m also concerned by the negative price performance over the years which resulted in mediocre returns and I don’t see any catalyst that could change this trend. Despite DIV’s cheap valuation, I think there are better opportunities in the market at the moment.
[ad_2]
Source links Google News

