")
[ad_1]
Vertigo3d/E+ via Getty Images
The SoFi Select 500 ETF (SFY) is a zero-expense (assuming fee waivers) alternative to the U.S. bellwether equity funds focusing on the growth factor.
Despite being a relatively novel smart-beta fund with less than three years in the books and just around $377 million in assets under management, SFY does have a few solid advantages: its 0% fees (at least until June 30, 2022, as of the factsheet), alpha since inception (discussed below), an acceptable level of risk in the past, and almost impeccable quality (over 94% exposure to the factor).
But the story surely does not end here. SFY has a few material drawbacks that make me feel a bit cautious, thus it is only a Hold. Let us discuss all these in greater depth below in the article.
Investment strategy
SFY’s investment mandate is to track the smart-beta Solactive SoFi US 500 Growth Index.
The selection pool consists of around 3,000 American companies from the Solactive US Broad Market Index. The 500 most expensive go to SFY’s benchmark, where they are weighted using two variables: free-float market capitalization and a proprietary composite score. The latter is the amalgamation of two backward-looking metrics: TTM sales growth and TTM earnings per share growth, as well as one forward-looking: twelve-months EPS growth consensus estimates.
The index is rebalanced and reconstituted only once a year, in May. More details can be found in the prospectus and the Solactive index guideline.
Please take notice that the index does not attempt to pick top growth stocks. It is by no means its purpose. By contrast, it just amplifies the impact of investor perception of faster earnings & sales growth on returns, another way of saying, slightly tilting the portfolio towards the growth factor, so the presence of pure-value stocks like Berkshire Hathaway (BRK.B) should not come as a surprise; their weight is what should not be overlooked, i.e. ~0.67% of SFY’s net assets (as of February 4) are allocated to BRK.B compared to ~1.5% of the iShares Core S&P 500 ETF (IVV).
It should be noted that value players do somewhat skew returns of growth-focused indices, so investors seeking exposure to purer alternatives should take a close look at funds like the Invesco S&P 500 Pure Growth (RPG), for example.
A closer look at returns
From 30 April 2019 to 31 January 2022, SFY grossly outperformed the iShares Core S&P 500 ETF (IVV), delivering a compound annual growth rate of ~19.7% vs. IVV’s ~18.8%. SFY’s zero expenses were likely supportive of that, though IVV has a fairly wafer-thin ER of just 3 bps. A higher Sharpe ratio pointing to the lower level of risk is amongst other pleasant surprises, though the Sortino ratio is softer, well below the desirable level of 2.
Returns comparison (Created by the author using data from Portfolio Visualizer)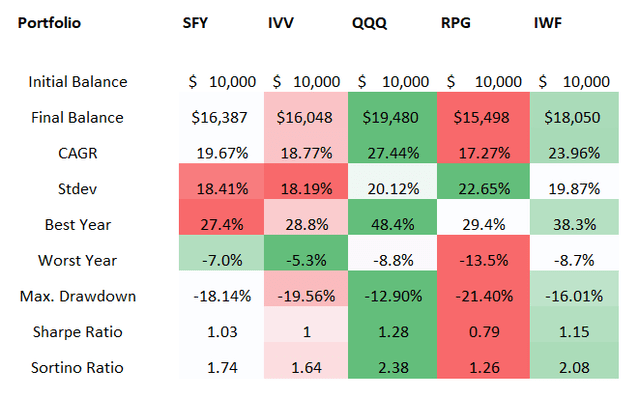
Please take notice that returns above include the January 2022 market correction, when IVV fared a bit better thanks to its larger exposure to pure-value stocks (RPV), while SFY’s growth focus more likely was more of a drag. Meanwhile, RPG with its maximalist growth strategy suffered badly.
IVV, RPG, QQQ, SFY, IWF returns comparison (Portfolio Visualizer)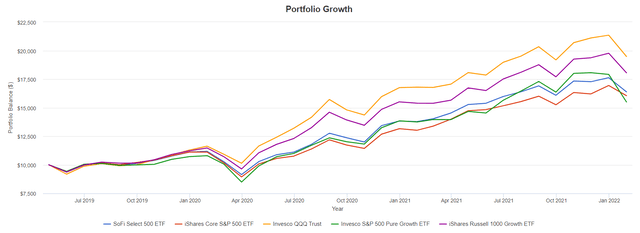
However, the fund still obviously has disadvantages.
I have compared its risk and return metrics with a few other large-cap growth funds I have covered on Seeking Alpha, with the results clearly not being in favor of SFY.
First, with QQQ and IVV removed from the comparison, the iShares Russell 1000 Growth ETF (IWF), the closest peer that focuses not simply on the U.S. bellwethers but also adds a growth screen, seizes first place, as, over that relatively short period, it not only outperformed RPG and SFY but also appeared to be less risky given the better Sortino and Sharpe ratios. IWF’s expense ratio is 19 bps.
And second, the Invesco QQQ ETF (QQQ), a tech-heavy fund, outperformed all the funds compared, with the highest CAGR and Sharpe and Sortino ratios, even assuming the IT sell-off has taken its toll.
Assessing value, growth, and quality factors
As of February 4, SFY was long 502 stocks, with the top ten having around 32.8% weight, which is a bit higher compared to IVV’s ~28.7%.
Though its number of holdings is similar to IVV, a few profound differences can be spotted upon deeper inspection, and not only those related to stock weights. More specifically, 75 stocks (close to 3% weight) from the S&P 500 are not present in the SFY portfolio, namely Linde (LIN), NXP Semiconductors (NXPI), etc., while 72 those from the SFY basket did not qualify for the S&P 500, like Peloton (PTON) and Lyft (LYFT).
Its sector mix deviates only marginally from the one IVV has, with IT expectedly having a bit larger allocation. Consumer discretionary stocks are noticeable another deviation, thanks to SFY being overweight Tesla (TSLA) and Amazon (AMZN).
IVV, SFY sector exposure (Created by the author using data from SFY, IVV, IWV)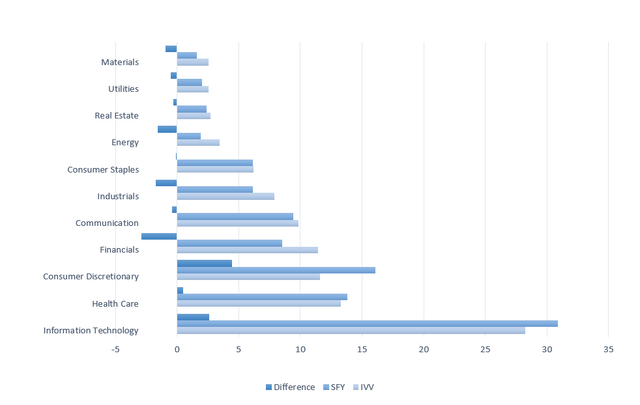
As usual, using the data from the Seeking Alpha screener, I have assessed the fund’s exposure to the key factors like growth, value, and quality (profitability), with the following results:
- SFY has ~75.3% allocation to grossly overweight stocks (D+ Valuation grades or worse) vs. IVV’s ~72%. ~12.4% of SFY’s net assets are invested in stocks with value characteristics vs. IVV’s ~13.7%. It goes without saying that both are exposed to the evaporation of growth premia across the board.
- In terms of exposure to companies improving their sales and profits, SFY definitely has an edge over IVV, with a ~32.7% share of holdings boasting at least a B- Growth grade. IVV has ~28.7%.
- To bring a bit more color, it is worth noting that ~26% of companies in the SFY basket have forward revenue growth rates (based on consensus analyst estimates) equal to or exceeding 20%. For IVV, this ratio is ~18.6%. To bring even more color, three months ago, IWF had ~37.3% allocation to such players.
- Over 49% have forward EPS consensus growth rates of at least 20%; for IVV, it is 45.3%.
- The level of quality is consistent with SFY’s mega/large-cap focus: ~94.2% have Profitability grades of B- or better vs. IVV’s 94.4%.
Final thoughts
SFY’s unquestionable advantages are zero expenses (for now) and almost perfect quality (mostly as a direct consequence of the mega-cap tilt) coupled with relative outperformance since inception.
On the negative side, its minimalist smart-beta methodology is certainly not the best in class considering a few peers were doing way better amid the tailwinds of the ultra-loose monetary policy, with better returns and seemingly lower risk.
Also, depending on the pace of interest rate increases in the U.S., the growth stocks might continue suffering, though I frankly believe that the worst is likely over for them, as I have recently added Microsoft (MSFT) to my portfolio, albeit again it should be remarked here that this decision is backed by a relatively high level of risk tolerance as well as the fact that I anticipate mega-size tech to perform better (excluding Meta Platforms (FB)) in the hawkish scenario compared to the large- and especially mid-cap echelons. Besides, even if softness continues, SFY’s exposure to pure-value stocks can still somewhat minimize the potential damage. Anyway, I see no reason why growth style optimists should consider buying into funds that are content with deeply undervalued companies impacting their performance.
Considering all the pros and cons, I believe SFY is a Hold.
[ad_2]
Source links Google News