[ad_1]
 (Source – Pexels/Phan Dang Viet Tung)
Vietnam has come a long way over the past two decades. It has maintained a GDP growth rate above 6% for most years since the Asian financial crisis and has seen the purchasing power of its citizens rise from $2000 to over $6000 today and is accelerating even higher.
As China’s new middle class is demanding higher wages, more and more factories are being moved to Vietnam. Even more, if the U.S. tries to move its companies out of China many will be headed for Vietnam. Needless to say, the country looks like a great growth opportunity from both a long- and short-term perspective.
Usually, a growth opportunity like Vietnam comes at a high price as valuations tend to account for growth. This is only partly true for Vietnam which has most equities trading at or around a 15-20X “P/E” ratio which is lower than what is usually seen in the United States. To make it even better, the Vietnamese Dong is (usually) pegged to the U.S. dollar, so the fund has lower currency risk.
An easy way to invest in Vietnam is through the VanEck Vectors Vietnam ETF (VNM). Let’s take a deep dive into the fund to see if it is likely to outperform other single-country ETFs.
The Vaneck Vectors Vietnam ETF
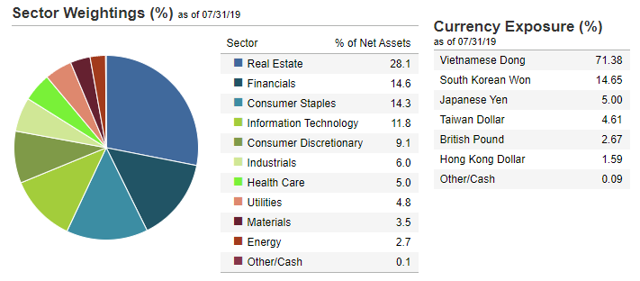
Talk about alliteration. The fund has been trading since 2009 and currently has 27 holdings, 70% of which are based directly in Vietnam and 15% in South Korea (but still generate most of their revenue in Vietnam).
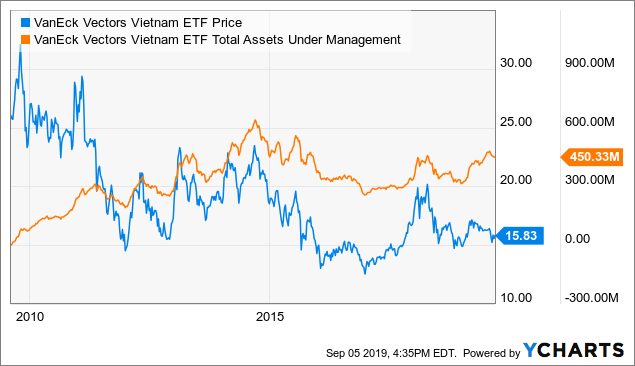
The fund has seen increased popularity in recent months as the growth potential in Vietnam is just starting to come to investors’ attention due to the trade war. The fund currently has a solid $450M in AUM which makes it more than liquid enough for the vast majority of investors. Let’s take a closer look at that AUM to see what our fellow investors are up to:
 Data by YCharts
As you can see, the fund has seen stable inflows despite weak performance over the past decade. AUM appears to be trending higher since 2016 which is a solid indicator that better equity performance may be on the horizon.
The fund has a low expense ratio of 0.68% (given its exotic nature) and pays a low dividend yield of 0.86%. The low yield is actually a good sign because it implies that the companies in the fund have a high internal return on investment. The fund also has a weighted average “P/E” ratio of 19X and a “P/B” of 2.5X. Remember, if you expect a recession around the corner it is usually GARP (growth at a reasonable price) stocks like those in VNM that perform the best.
The fund is about as risky as most with a 15% yearly standard deviation and has seen 50%+ years as in 2017 followed by a 25% loss last year. If recessionary probabilities continue to climb, the fund is likely to fall lower, but this fund is still one of the few I’d be happy to invest in despite my bearish global economic expectations. Speaking of which, it only has a 0.5 correlation to the S&P 500 and a beta of 0.67, so it has some immunity to the global economy.
The fund is also diversified across quite a few sectors of the Vietnamese economy. Take a look at its sector and currency weightings below:
(Source – iShares)
As you can see, the fund is pretty heavily weighted toward real estate and financials which are riskier than the other sectors but are also likely to gain the most from industrialization in the country. Real estate is a bit expensive in Vietnam with price-to-income ratios between 10-20+, but this is much cheaper than found in the more developed areas of Asia.
Comparative Performance
One of my favorite ways to analyze single-country funds is by looking at its performance compared to the country’s neighbors. This is particularly useful for VNM as it is tremendously difficult to get in-depth fundamentals for companies listed on the Ho Chi Min stock exchange.
There are four countries that have very similar economies to that of Vietnam and act as good comparables: Thailand (THD), Malaysia (EWM), Indonesia (EIDO), and The Philippines (EPHE).
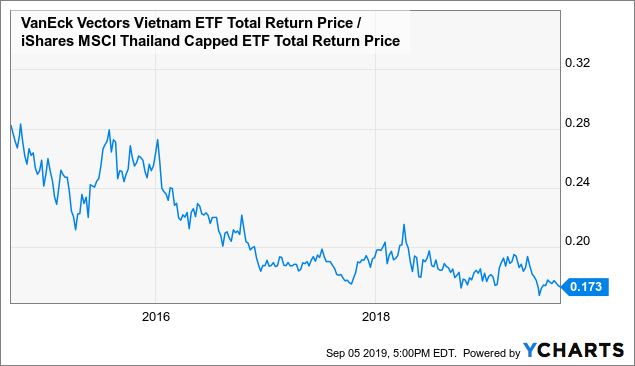
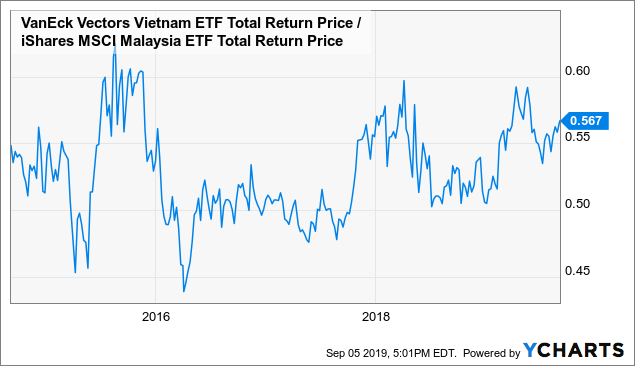
Let’s work our way through those four comps to see if VNM is likely to outperform them in months and years to come. To do this, I simply divide the total return price (which includes dividends) of VNM by the comparable ETFs. In doing so, we can see how a “long Vietnam short comparable” strategy has performed. More often than not with ETFs like these, a period of underperformance is matched by a period of overperformance, particularly if the short-term trend is strong.
Here is the performance ratio for Thailand:
 Data by YCharts
Thailand has been one of the best performing stock markets during this bull cycle and has outperformed VNM by about 65% since 2014. As you can see, this trend is fading and it appears that it may turn up soon.
Moving on to Malaysia (EWM):
 Data by YCharts
This chart is much more constrained, which is a sign that Malaysia and Vietnam’s equity indices are closely tied together. As you can see, this chart mean-reverts often and is currently on a solid upward trend. If this ratio breaks to 0.60 handles, VNM could see a solid break-out. That said, because the chart mean-reverts, the opposite could also occur.
Moving on to Indonesia (EIDO) and the Philippines (EPHE):
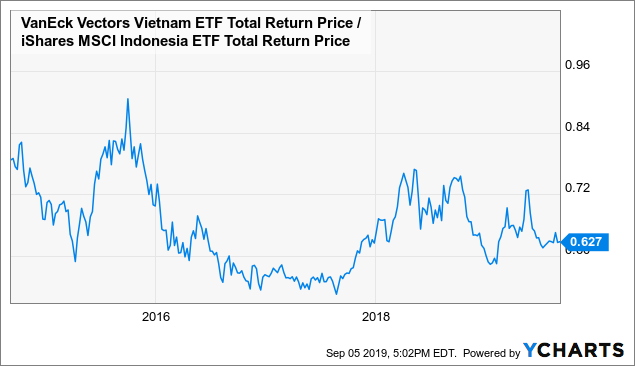 Data by YCharts
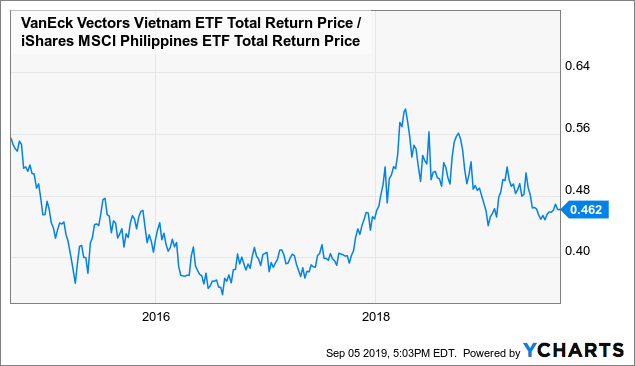 Data by YCharts
I included these together because the pattern in both is very similar and the ETFs of Indonesia and the Philippines are highly correlated. We see a great breakout in 2018 followed by a developing “falling wedge” pattern that often ends in a breakout to the upside.
Let’s move over to the countries’ leading economic indicators and geopolitical situation to see if the bullish chart patterns are confirmed by the economic fundamentals.
Ongoing Economic Resiliency
There is currently a global economic downturn and whenever these downturns occur, there are always a few select countries that avoid the crisis. In 2008, this was the Australiasian region. Today, it is the United States and a few others like Vietnam.
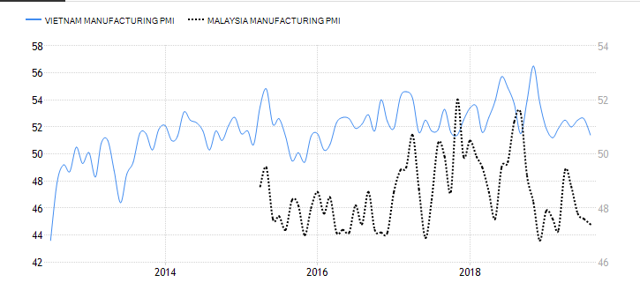
The easiest way to see this trend is through the manufacturing PMI which measures purchasing manager decisions and production output. For industrializing economies like Vietnam’s, this signal is a great leading GDP growth indicator.
Here is the manufacturing PMI for Vietnam compared to its best peer Malaysia:
(Source – Trading Economics)
As you can see, the PMI number has been consistently running higher than that of Malaysia and remains above 50 which implies that manufacturing growth will remain positive.
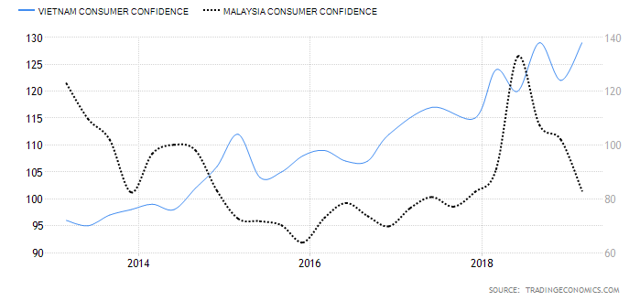
This divergence is seen even better in the consumer confidence trend of each country:
 (Source – Trading Economics)
As you can see, consumers in Vietnam are at extremely high confidence and trending higher while consumer confidence of Malaysia is crashing down. This is yet another sign that Vietnam is successfully avoiding an economic slowdown.
Why? One major reason is the U.S.-China trade war. Vietnam is one of the few benefactors of the trade war as it exports heavily to both China and the United States. If China is the “factory of the world” then Vietnam is the “factory of China” and may even become a new “factory of the world” if the U.S. continues to slow imports from China.
The country is successfully dealing with both countries both economically and politically. To a certain extent, Vietnam is in a similar position to Egypt during the cold war when the U.S. and the Soviet Union fought economically to win over the country. The only difference is Vietnam can stand on its own two feet as it already has a relatively diversified economy.
The Bottom Line
Overall, VNM looks like a solid single-country ETF for a long-term investor, particularly one who wants heavy diversification and growth at a reasonable price. The ETF is beginning to outperform its peers and the country’s economy has been successfully weathering the global economic downturn. Even more, it is one of the few equities that offer a hedge against the trade war.
Overall, I give the ETF a “buy” rating. That said, I also prefer to be equity-neutral at this point because it seems like global equities have more downside ahead of them. Thus, if I make an investment it will probably be done via a long Vietnam short Malaysia pair trade (VNM)/(EWM) which not only has a great chart pattern but also has great macroeconomic fundamentals.
Interested In Closely Following Global Events?
“The Country Club” is a dedicated service that focuses on single-country and regional ETFs with the goal of helping our subscribers diversify globally and get a better grasp on how world events will affect their portfolio. We will certainly be providing subscribers further updates on this idea.
Subscribers receive exclusive ideas, model portfolios, and a wide range of tools, including our exclusive “Country Club Dashboard” which allows them to visualize global financial and economic data. If you haven’t already, please consider our 2-week free trial and get your passport to global markets today!

Disclosure: I/we have no positions in any stocks mentioned, but may initiate a long position in VNM over the next 72 hours. I wrote this article myself, and it expresses my own opinions. I am not receiving compensation for it (other than from Seeking Alpha). I have no business relationship with any company whose stock is mentioned in this article.
Additional disclosure: May also short EWM, or THD in next 72 hours
[ad_2]
Source link Google News
