
[ad_1]
Consider My Predictions
The Federal Reserve will not cut the federal funds rate until the fourth quarter after they complete quantitative tightening at the end of September.
The trade war with China keeps downward pressure on stocks.
Government regulators continue to investigate the FAANG stocks.
The Iran situation is a wildcard, but higher oil prices are buoyed by the huge inventory build in the USA.
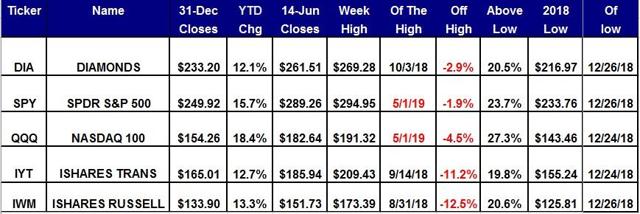
Here’s Today’s Scorecard
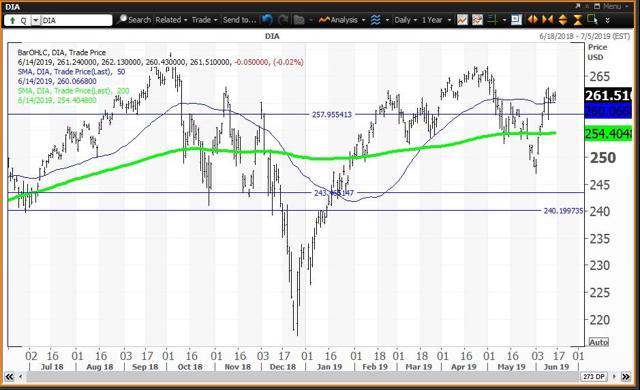
SPDR Dow Jones Industrial Average ETF (NYSEARCA:DIA)
 Courtesy of Refinitiv XENITH
The Diamonds ETF is 20.5% above its 2018 low of $216.97 set on Dec. 26 and is 2.9% below its all-time intraday high of $269.28 set on Oct. 3. The all-time closing high is $267.67 also set on Oct. 3. The 2019 high remains at $266.86 set on April 23. Diamonds is above its 200-day simple moving average at $254.40.
Diamonds is above its five-week modified moving average at $258.68 with its 12x3x3 weekly slow stochastic reading rising to 44.39 last week, up from 43.31 on June 7. Semiannual and monthly value levels are $243.47 and $240.24, respectively, with weekly and annual pivots at $253.43 and $257.94, respectively, and quarterly risky level at $279.04.
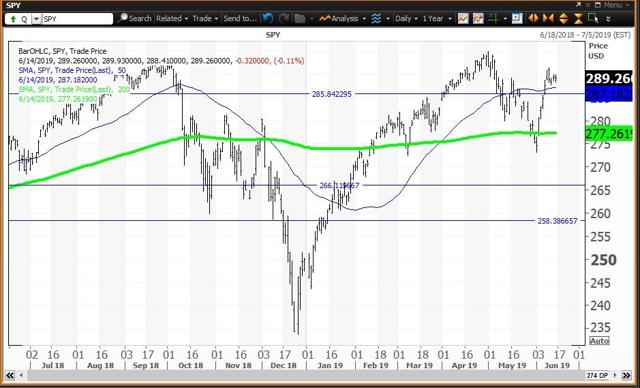
SPDR S&P 500 Trust ETF (NYSEARCA:SPY)
 Courtesy of Refinitiv XENITH
The Spiders ETF is 23.7% above its Dec. 26 low of $233.76 and is 1.9% below its all-time intraday high of $294.95 set on May 1. The all-time closing high was set at $294.34 on April 30. Spiders is above its 200-day simple moving average at $277.26.
Spiders is above its five-week MMA at $285.57 with its 12x3x3 weekly slow stochastic reading declining to 52.26 last week, down from 54.93 on June 7. Semiannual and monthly value levels are $266.14 and $258.62, respectively, with weekly and annual pivots at $284.58 and $285.86, respectively, and quarterly risky level at $297.56.
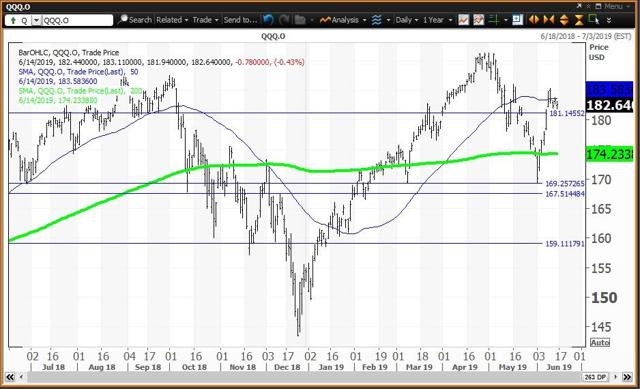
Invesco QQQ ETF (NASDAQ:QQQ)
 Courtesy of Refinitiv XENITH
The QQQ ETF is 27.3% above its 2018 low of $143.46 on Dec. 24. QQQ is 4.5% below its all-time intraday high of $191.32 set on May 1. The all-time closing high is $191.11 on May 3. QQQ is above its 200-day simple moving average at $174.23.
QQQ is above its five-week MMA at $181.32 with its 12x3x3 weekly slow stochastic reading falling to 50.42 last week, down from 54.83 on June 7. Annual, semiannual and monthly value levels are $169.27, $167.53 and $159.08, respectively, with a weekly pivot at $178.88 and quarterly risky level at $194.29.
iShares Transportation Average ETF (NYSEARCA:IYT)
 Courtesy of Refinitiv XENITH
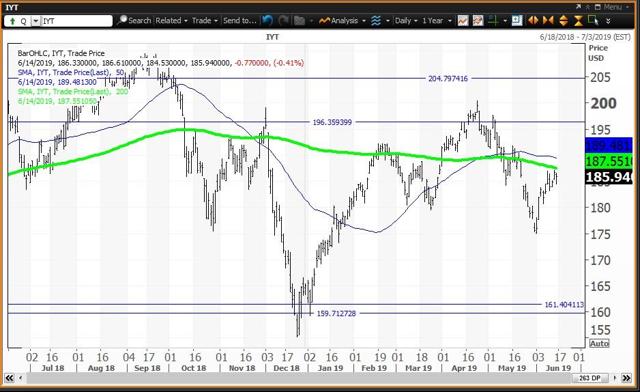
IYT is 19.8% above its 2018 low of $155.24 set on Dec. 24. The ETF is in correction territory 11.2% below its all-time intraday high of $209.43 set on Sept. 14. The closing high of $208.48 was set the same day. The 2019 high of $200.42 was set on April 24. Transports is below its 200-day simple moving average at $187.55.
IYT is below its five-week MMA at $186.06 with its 12x3x3 weekly slow stochastic reading declining to 33.57 last week, down from 37.78 on June 7. Monthly and semiannual value levels are $161.36 and $159.63, respectively, with annual and quarterly risky levels at $196.35 and $204.78, respectively.
iShares Russell 2000 ETF (NYSEARCA:IWM)
 Courtesy of Refinitiv XENITH
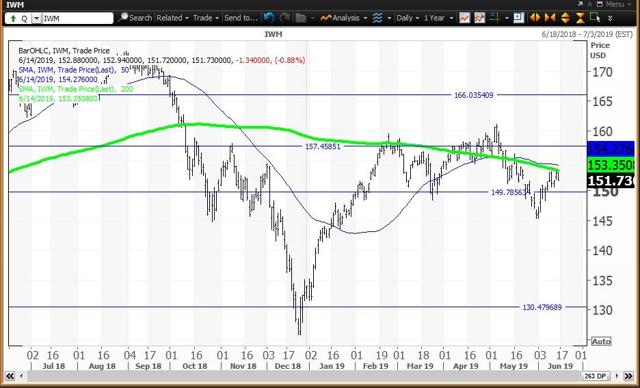
IWM is 20.6% above its 2018 low of $125.81 set on Dec. 26 and is in correction territory 12.5% below its all-time intraday high of $173.39 set on Aug. 31. The all-time closing high at $173.02 was set the same day. The 2019 high is $161.11 set on May 6. The Russell 2000 is below its 200-day simple moving average at $153.35.
IWM is below its five-week MMA at $152.33 with its 12x3x3 weekly slow stochastic reading falling to 35.13, down from 39.51 on June 7. Its monthly value level is $130.45 with its semiannual pivot at $149.77 and annual and quarterly risky levels at $157.49 and $166.03, respectively.
How to use my value levels and risky levels:
Value levels and risky levels are based upon the last nine weekly, monthly, quarterly, semiannual and annual closes. The first set of levels was based upon the closes on Dec. 31. The original semiannual and annual levels remain in play. The weekly level changes each week; the monthly level was changed at the end of January, February, March, April and May. The quarterly level was changed at the end of March. My theory is that nine years of volatility between closes are enough to assume that all possible bullish or bearish events for the stock are factored in. To capture share price volatility, investors should buy on weakness to a value level and reduce holdings on strength to a risky level. A pivot is a value level or risky level that was violated within its time horizon. Pivots act as magnets that have a high probability of being tested again before its time horizon expires.
The close on June 28 is the second most important for 2019. This close is an input to my proprietary analytics and will generate new weekly, monthly, quarterly and semiannual levels.
Disclosure: I/we have no positions in any stocks mentioned, and no plans to initiate any positions within the next 72 hours. I wrote this article myself, and it expresses my own opinions. I am not receiving compensation for it (other than from Seeking Alpha). I have no business relationship with any company whose stock is mentioned in this article.
[ad_2]
Source link Google News