[ad_1]

So let’s talk high income!
Over the years I have discussed a number of asset classes and ETF investments which focus on very high income, or more precisely distribution rates.
These would be asset classes such as closed-end funds and REITs, many of which are packaged in the very popular leveraged and unleveraged ETFs.
As we saw however, many of those funds, while they distributed high rates, also had a tough time maintaining their net asset values.
One other asset class that I feel is misunderstood but purchased nevertheless are BDCs, or business development companies.
BDCs are a tax code much like REITs, closed-end funds and ETFs. BDCs themselves are very different and may invest in a variety of investments such as leveraged loans, senior loans or even private equity investments. As with all investments, you must look at the underlying holdings rather than assume all BDCs are the same.
One of the more popular funds in this space is the VanEck Vectors BDC Income ETF (BIZD).
The reason I wanted to take a look at this fund today is that BDCs are an asset class which will be significantly impact by any slowdowns, and we are seeing more and more signs of an impeding recession presenting itself throughout the economy.
So what is the VanEck Vectors BDC Income ETF all about? What should be our expectations? Let’s take a look!
Investment Case
BDCs are an asset class where you will have access to assets you would generally not find on the open markets. These would be things such as senior loans funds that are not merely syndicated, but are originated and invested in smaller and midsized companies. These could be venture deals, real estate or a myriad of debt options.
Generally, BDCs are going to deal in lower or unrated credit ratings and higher risks. As such, this is why BDCs will have a significantly higher distribution rate.
Of course, much like with closed-end funds, BDCs pay out a distribution and not necessarily an earned dividend and must be taken into account.
Fund Basics
- Sponsor: VanEck
- Index: MVIS® US Business Development Companies Index (MVBIZDTG)
- AUM: Approximately $205 million (6/6/2019)
- Historical Style: Publicly Traded BDCs
- Investment Objectives: Seeks to provide investment results that correspond generally to the price and yield performance, before fees and expenses, of the MVIS® US Business Development Companies Index
- Number of Holdings: 25 securities.
- Current Yield: 9.18% 30-Day SEC yield, 10.11% distribution yield
- Inception Date: 2/11/2013.
- Fees: .41% fund fee plus 9% acquired funds fee. 9.41% total annual expense.
Source: YCharts & VanEck
The Index and The Fund
VanEck is generally a transparent investment sponsor and typically uses their own Market Vectors indexes.
As mentioned above, this ETF follows the MVIS US Business Development Companies Index.
What’s quite nice is that VanEck even has a section on the ETF page discussing the underlying index without having to dig into the index methodology. You can find that page here.
The index is fairly simple and is focused on two factors, size and trading volume.

Source: VanEck Website
The index looks at BDCs with a minimum market capitalization of at least $150 million.
The methodology then excludes BDCs which are thinly traded, such as those that have a three month average daily trading volume below $1 million and a minimum trading volume of under 250,000 shares each month over the previous six months.
The index uses a typical weighting methodology and does cap its holdings at 20%. The resulting portfolio is then rebalanced quarterly.
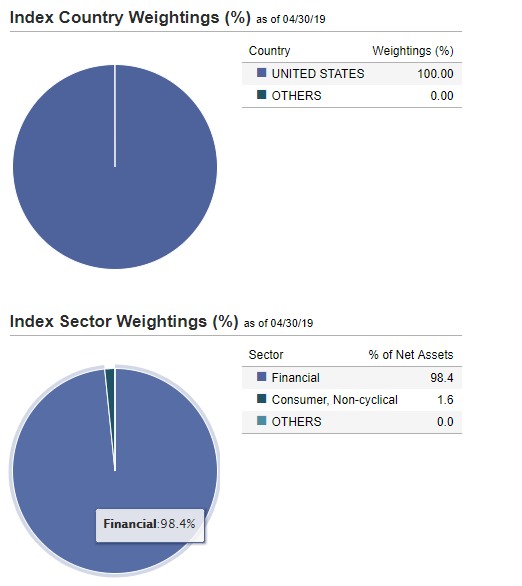
Looking at the index characteristics, we can see that it’s made up of just 25 securities, and as expected predominantly smaller holdings, domiciled in the United States and categorized as financials.
Source: VanEck
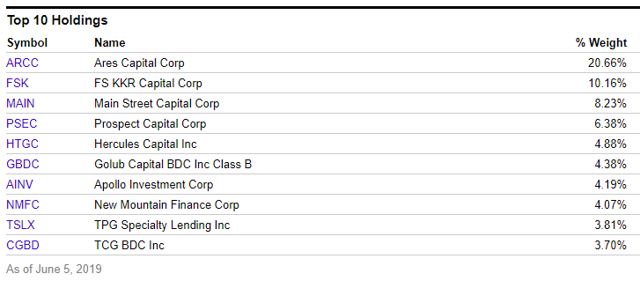
Turning to the fund, we can indeed find that it’s not well balanced and is indeed quite concentrated.
Looking at the top 10 holdings shows us a fund consistent with most “market cap weight” capitalization methodologies investing in a niche space. The top 10 holdings represent just over 70% of the fund. The top holding, Ares Capital Corp (ARCC), accounts for more than one fifth of the ETF.
FS KKR (FSK), Main Street Capital (MAIN), Prospect Capital (PSEC), Hercules Capital (HTGC), Golub Capital (GBDC), Apollo Investment Corp (OTC:AINV), New Mountain Finance (NMFC), TPG Specialty Lending (TSLX) and TCG BDC (CGBD) round out the top 10.
 Source: YCharts
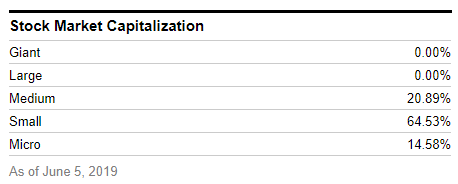
Looking at the market capitalization breakdown, we can see that the fund is predominantly focused on small caps. This is purely due to the size of the BDC marketplace and the limited availability of investments. As it is, Ares Capital is the only “mid cap” investment in the fund.
Source: YCharts
As I wrote in a previous article,
One of the critical things to watch with new ETFs is their capital raise.
Running an ETF is not cheap and there are always questions as to how long a sponsor will keep the fund open if it does not raise sufficient capital in order to generate income for the sponsor to keep the fund going. Over the past few years, we have covered a number of funds which seemed like great ideas, yet were not successful in their capital raise and were forced to shut down.
Source: “Fidelity MSCI Real Estate Index ETF: Sometimes ‘Broader’ Is Better.”
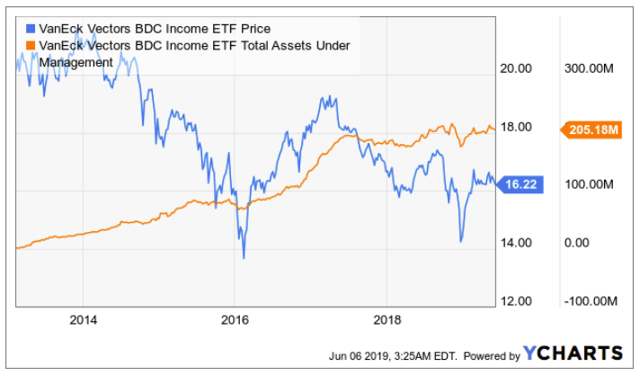
Despite the fact that the ETF has been losing its value per share, in large part due to the large distribution, the fund has been able to raise capital fairly well.
The fund is currently sitting on approximately $205 million in assets under management and in my opinion in a peculiar position.
Source: YCharts
On one hand, the fund currently has enough capital to pay for its expenses, and while the .41% direct expense is not super high, it’s also not cheap, especially since you are investing in a mere 25 names.
Putting more color to this, BIZD has raised the $192 million in AUM over the previous 12 months. The fund has managed to raise a mere $26 million.
Source: YCharts
So the question becomes… when we have another major correction and junk credit starts falling apart and the underlying BDCs start sustaining losses of 40% or more, will the fund remain open? Will the underlying BDCs keep on paying their high distributions?
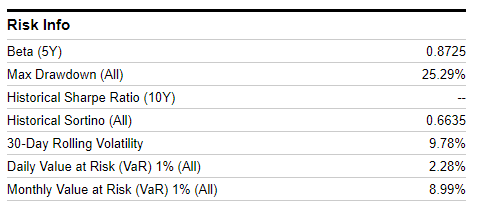
Looking at the risk statistics provided by YCharts, we can see how the fund compares against the S&P 500. What we find is that fund has a five-year beta of .8725 vs. the S&P 500 and had a maximum draw down of 25.29%.
Source: YCharts
What this tells us is that adding BIZD did reduce equity volatility. The fund did however sustain a draw-down of more than 25% in a credit bull market.
This is quite concerning as the fund did not exist during the 2008 credit crunch.
Performance
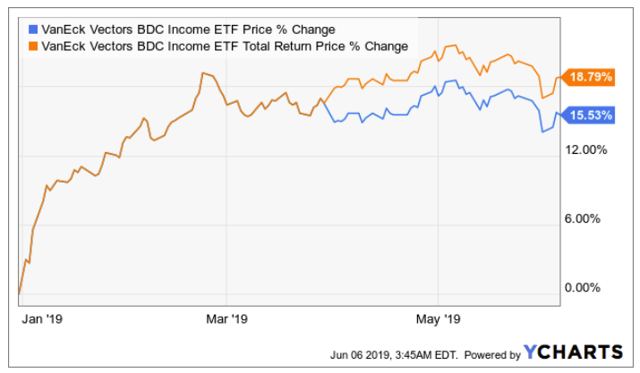
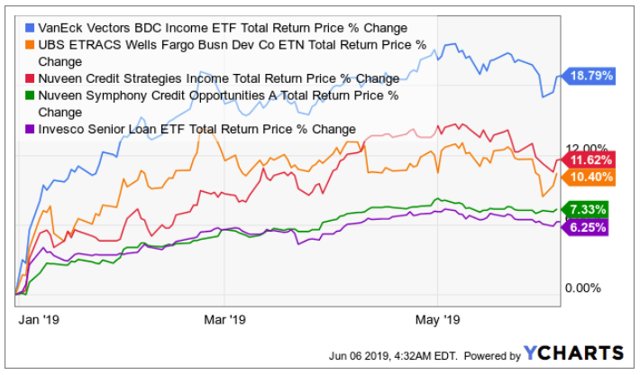
Like most other investments, year to date, the fund has done quite well and achieved an 18.79% total return. The price per share is up 15.53% with the balance being made up by the distribution.
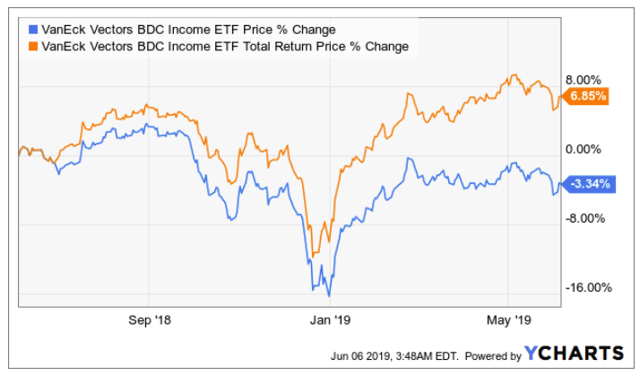
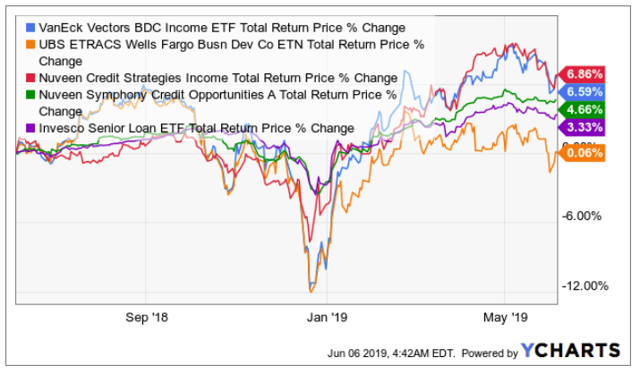
Over the previous 12 months the picture is not the same and is likely where we saw the maximum sustained draw down, from September 2018 through January 2019.
The fund did achieve a positive total return, 6.85%, made up entirely by the distribution. The price per share however is down 3.34% during this time period.
Considering that this is an ETF and not a closed-end fund, this implies the underlying BDCs had over distributed, something that is fairly common, especially when the main investment appeal is centered around a “high distribution.”
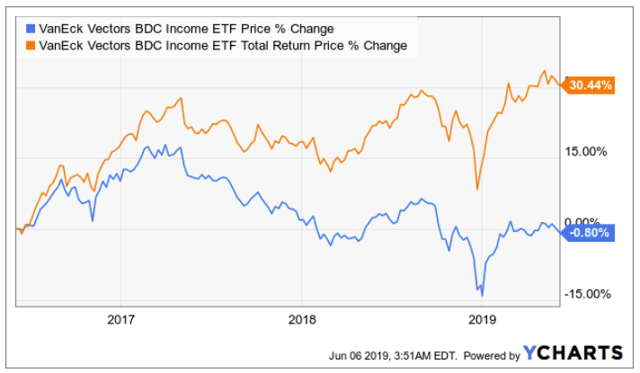
Looking back three years, we see yet another example of why dividends are an important aspect of overall returns.
During this time, the fund achieved a 30.44% total return while the price per share decreased .80%. The dividends made up the entirety of the total return.
What’s interesting is that the price per share has actually been declining since 2017. Right around this point, it’s fairly safe to assume the underlying fundamentals of BDCs starting turning as from that point on, there was a 15% decrease in the price per share.
Since inception, the results continue to extrapolate. The fund achieved a 34.97% total return while the price per share decreased 19.58%.
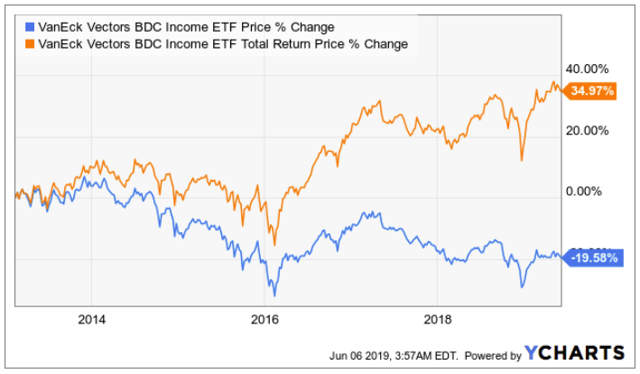
Yes, the BDCs are earning income but they are also over distributing by quite a lot.
Where this is critical is for investors who are living off of the income. As such, your $100 invested is now worth $80 assuming you lived off of all of the income and did not reinvest it in more shares.
So how did this fund do vs. its largest direct competitor, the UBS ETRACS Wells Fargo Business Development Company ETN (BDCS)?
More importantly, with their near 10% annual expense, would investors simply be better off investing in a senior loan CEF, ETF or mutual fund?
On the fund side, we can take a look at one of my favorite in this space, the Nuveen Credit Stategies Fund (JQC) which I recently covered in “Nuveen Credit Strategies Income Fund: When ‘Junk’ Is Great To Own.” Nuveen also has an open end fund version of this strategy in the Nuveen Credit Opportunities Fund (NCOAX)(NCOIX).
Lastly, we can take a look at the broad Senior Loan ETF, the Invesco Senior Loan ETF (BKLN).
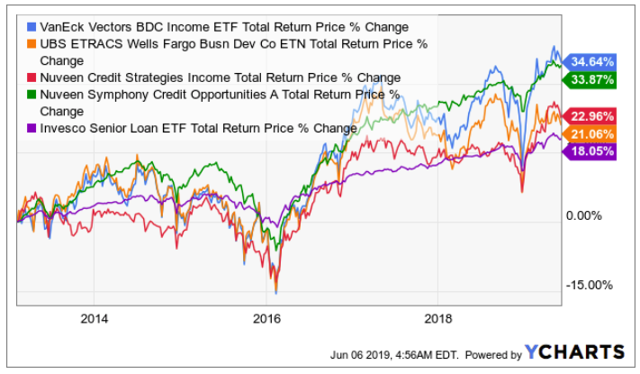
As we can see, year to date, all of the funds achieved positive returns. The VanEck BDC fund did outpace the others as the BDCs (often leveraged) recovered quite strongly. Interestingly, the Nuveen CEF outperformed the UBS BDC ETN. The UBS ETN follows the Wells Fargo BDC index rather than the smaller index followed by the VanEck ETF.
Over the previous 12 months, the VanEck ETF trailed our recently-looked at CEF but outperformed its unlevered, plain vanilla mutual fund. Both however outperformed the Invesco Senior Loan ETF and the UBS Etracs ETN.
Looking back three years, we continue to see the trend play out.
Interestingly, the two BDC funds traded in lockstep through 2018 but then moved at different paces.
Further of interest, the open end, unlevered Nuveen Symphony Credit Opportunities fund came in just a few percentage points behind. Despite lagging, it was far more stable.
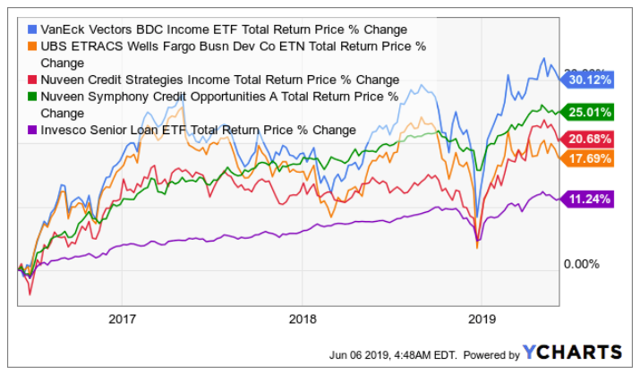
Looking further back through to inception we find the difference in the two funds was even less and the open end fund was far less volatile.
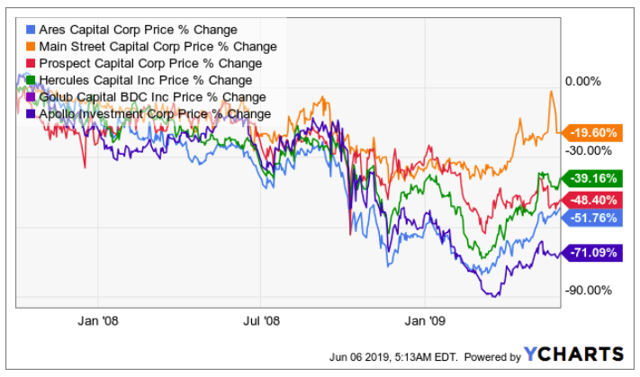
Since we want to take a look at how this ETF would have performed during the credit crunch, we can look at the performance of the underlying BDCs that existed at that point.
As we can see, with the exception of Main Street Capital, the rest of the BDCs had massive losses and are in many cases still below those levels.
Bottom Line
Overall, the VanEck Vectors BDC Income ETF did precisely what it was supposed to. It tracked the performance of the largest publicly traded BDCs.
More than that, it outperformed the competing exchange traded product, the UBS ETRACS Wells Fargo BDC ETN (BDCS).
One reason for this may be that the Wells Fargo Index seems to track significantly more positions, many of them would be smaller BDCs. As such, in a bull market, the performance of the smaller funds would help, and now that the underlying credit markets are turning, the smaller BDCs would be suffering more. That seemingly explains the recent relative performance.
As such, if I was picking between the two BDC tracking funds, I would pick the VanEck fund. The additional benefit is the lower fund fee and the fact that it’s in fact an ETF, and not merely a debt obligation.
Beyond that, I believe investors need to seriously consider whether they want to be invested in BDCs at this point of the credit cycle.
Myself, I have been following two bankruptcies to which a few of the major BDCs have exposure to. One of them is a major firearms distributor that has been in default of their senior loan. The other is a media company where my spouse published crafts patterns.
Both of these are representations of the types of risks present in publicly-traded BDCs.
As such, IF I wanted to have exposure to above market income, I would consider unlevered funds until we see the bottom of the cycle at which point I would look into the BDCs.
More than that however, I don’t believe passive ETFs make sense for the fixed income space and especially the BDC world where management makes all of the difference in performance.
Simply put, any investors who did their due diligence and just purchased the Main Street Capital BDC (MAIN) would have triple the investment returns.
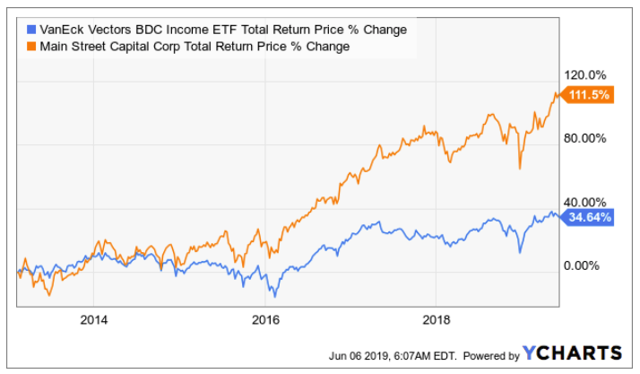
And THAT is the entire point of passive strategies in a space where details make all of the difference.
For more information on the fund, visit VanEck’s website here.
Thanks for reading! I hope that was helpful and look forward to your questions or comments.
 We all know, it’s not about how much you make, but about how much you keep. My focus will be on the latter — making sure you preserve the income that you earn.
With every new research article, Income Idea subscribers will be able to see a detailed analysis along with our take on the investment and the sponsor, along with actionable ideas and strategies of how to implement it into your portfolio if we feel it belongs there.
Disclosure: I/we have no positions in any stocks mentioned, and no plans to initiate any positions within the next 72 hours. I wrote this article myself, and it expresses my own opinions. I am not receiving compensation for it (other than from Seeking Alpha). I have no business relationship with any company whose stock is mentioned in this article.
[ad_2]
Source link Google News

