[ad_1]
I finally found some time to do my one-year review of the AAM S&P 500 High Dividend Value ETF (SPDV). Last year, I posted an article about SPDV not being as compelling as some others thought it was. The reasons behind that opinion were the fund had very low trading volume and low assets, which are important in judging closing risk. In addition, I argued that the fund would get lost in the dividend ETF field because its expense ratio was higher than many other popular dividend ETFs and its performance was closely aligned to that of the S&P 500 (SPY). One year later, trading volume has picked up a little bit, and assets have slowly increased, but the most important aspect being performance continues to show SPDV is not a compelling ETF in comparison to other dividend ETFs.
Volume and Assets
For SPDV, one encouraging thing as I noted above is volume has increased and assets have increased. The following table shows that prior to when my article was posted last year, SPDV had an average volume of 4,738 share/day. Since my article was posted, the average daily volume is up to 7,256 share/day. When it comes to assets under management, when I posted my original article SPDV had $2.65 million in assets and today assets are up to $32, which is an impressive increase. While the volumes are still very low in comparison to other dividend ETFs, they have increased enough that when combined with the increase in assets, closure risk for SPDV has decreased.
Volume
|
Average |
Median |
|
|
November 29th 2017 to March 9th 2018 |
4,738 |
1,500 |
|
March 12th 2018 to March 8th 2019 |
7,256 |
3,500 |
Performance vs. S&P 500
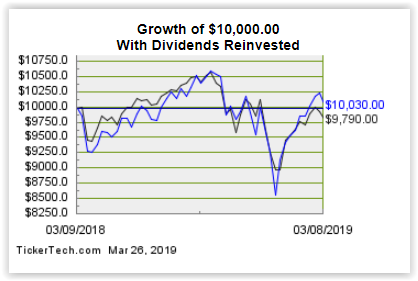
Regardless of what others may say, the first judgment of performance should be against the listed benchmark on the SPDV website. The benchmark that is listed on the SPDV website is the S&P 500 index. The chart below shows the performance of SPDV compared to SPY from when my original article was posted until one year later. As you can see, even when dividends are included, SPDV underperformed its benchmark.
Blue Line: SPY
Black Line: SPDV

DividendChannel.com
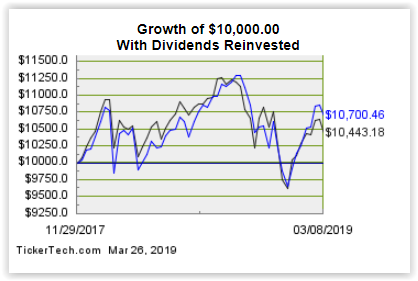
The next chart I will examine shows the performance of SPDV compared to SPY from its inception on November 29th 2017 until March 8th, which is one year after I posted my original article. As you can seem SPDV has underperformed SPY since its inception.
Blue Line: SPY
Black Line: SPDV

DividendChannel.com
Performance vs. SDOG
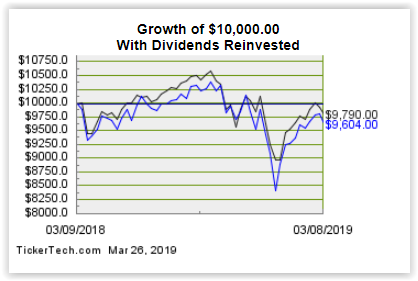
The closest direct competitor to SPDV is the ALPS Sector Dividend Dogs ETF (SDOG). Others have covered the comparison to SDOG multiple times, and yes, SPDV has outperformed SDOG over the past year. If you are looking for a narrow fund that has equally weighted holdings, equally weighted sectors and focuses on yield, SPDV and SDOG are the two choices and SDPV is the winner. However, that is where the good news for SPDV stops, because as I will show in the next section, SPDV underperforms all popular dividend ETFs and an S&P 500 value ETF (SPYV) that another author compared SPDV to.
Blue Line: SDOG
Black Line: SPDV

DividendChannel.com
Performance vs Other ETFs
The table below shows the total returns of many popular dividend ETFs from March 9th 2018 (date of my article), until March 8th 2019. As you can see, SPDV is near the bottom in terms of performance and it is clear that there are many superior dividend ETFs in the marketplace. In addition, the right side of the table below shows the expense ratio for each fund I looked at and SPDV is in the bottom half. With SPDV, you have a fund with poor performance and average fees at best. That is not a combination that inspires confidence in it as a possible investing choice if someone is looking for a dividend focused ETF.
|
Total Return |
Expense Ratio |
|||
|
(HDV) |
7.80% |
SPYV |
0.04% |
|
|
(SPHD) |
7.58% |
VYM |
0.06% |
|
|
(SPYD) |
7.02% |
SCHD |
0.06% |
|
|
(SDY) |
5.94% |
SPYD |
0.07% |
|
|
(NOBL) |
3.30% |
HDV |
0.08% |
|
|
(VIG) |
3.29% |
VIG |
0.08% |
|
|
(DGRO) |
2.84% |
DGRO |
0.08% |
|
|
(DVY) |
2.80% |
SPY |
0.09% |
|
|
(SCHD) |
2.13% |
DGRW |
0.28% |
|
|
(DGRW) |
0.52% |
SPDV |
0.29% |
|
|
(VYM) |
0.51% |
SPHD |
0.30% |
|
|
SPY |
0.30% |
SDY |
0.35% |
|
|
(SPYV) |
-1.18% |
NOBL |
0.35% |
|
|
SPDV |
-2.10% |
DVY |
0.39% |
|
|
SDOG |
-3.96% |
SDOG |
0.40% |
|
|
(COWZ) |
-4.76% |
COWZ |
0.49% |
Closing Thoughts
In closing, the risk of closure for SDPV has decreased because of the increase in assets and the slight increase in volumes. However, based on the data I examined over the past year, I see no reason to change my opinion that SPDV is not a compelling ETF. If you are long SDOG, switching to SPDV looks like it might be a good idea, but beyond that, there is a wide array of better performing and cheaper dividend focused ETFs to choose.
Disclosure: I/we have no positions in any stocks mentioned, and no plans to initiate any positions within the next 72 hours. I wrote this article myself, and it expresses my own opinions. I am not receiving compensation for it (other than from Seeking Alpha). I have no business relationship with any company whose stock is mentioned in this article.
Additional disclosure: Disclaimers: The commentary does not constitute individualized investment advice. The opinions offered herein are not personalized recommendations to buy, sell or hold securities. As I have no knowledge of individual investor circumstances, goals, and/or portfolio concentration or diversification, readers are expected to complete their own due diligence before purchasing any stocks mentioned.
The strategies discussed are strictly for illustrative and educational purposes and should not be construed as a recommendation to purchase or sell, or an offer to sell or a solicitation of an offer to buy any security. There is no guarantee that any strategies discussed will be effective. The information provided is not intended to be a complete analysis of every material fact respecting any strategy. The examples presented do not take into consideration commissions, tax implications or other transactions costs, which may significantly affect the economic consequences of a given strategy.
This material represents an assessment of the market environment at a specific time and is not intended to be a forecast of future events or a guarantee of future results. This information should not be relied upon by the reader as research or investment advice regarding the funds or any security in particular.
[ad_2]
Source link Google News
