Trading ETFs While Volatility Explodes Higher
The stock market has blindly risen since October of 2019 and continued into 2020 with the market going higher by almost 5.2% represented by the SPY ETF since January 1, 2020. There was a short dip down at the end of January 2020 but within days the SPY ETF recovered all losses. During this move to the upside it seemed as if nothing could stop the stock market from continuing higher but in the last few days something has changed. Yes, price has come down but underneath the surface there appears to be significant risk entering into the market that is represented by the VXX ETF. Let’s take a closer look at the VXX ETF and Trading ETFs while Volatility Explodes Higher.
Let’s look at the VXX ETF profile here: https://www.marketwatch.com. The VXX ETF is the S&P 500 VIX Short Term Futures ETN it is a measurement of volatility of the S&P 500. Low volatility means that traders/investors do not have much concern for trading to the long side or investors being fully invested or invested with growth in mind. When volatility starts to move higher traders shorten their holding periods and look to start shorting the market. Investors will, at first, hedge their portfolio by buying Put contracts and may also start taking profits of holdings. Both Traders/Investors start to become more protective of their capital and that starts to increase the volatility of the stock market but for this article let’s just stay focused on the VXX ETF. It looks like the VXX is telling us that something is brewing underneath the surface so let’s take a deeper look.
What does a Trader and an Investor have in common?
Traders and Investors have different approaches on how to use their capital but they both have 1 important common denominator. They both look for divergences or to put it another way they both look for abnormalities. The Trader may use a certain indicator that suggests a Stock/ETF may move higher but hasn’t yet and they open a trade to take advantage of that abnormality. An Investor that uses a valuation metric like Price to Earnings Ratio may invest in a Stock/ETF if that valuation metric is undervalued relative to other Stock/ETFs. Let’s get right to the point and look at the chart below of the VXX ETF. We use charts from TradingView.com and if you haven’t tried this chart service yet you can click here TradingView.com and give them a try.
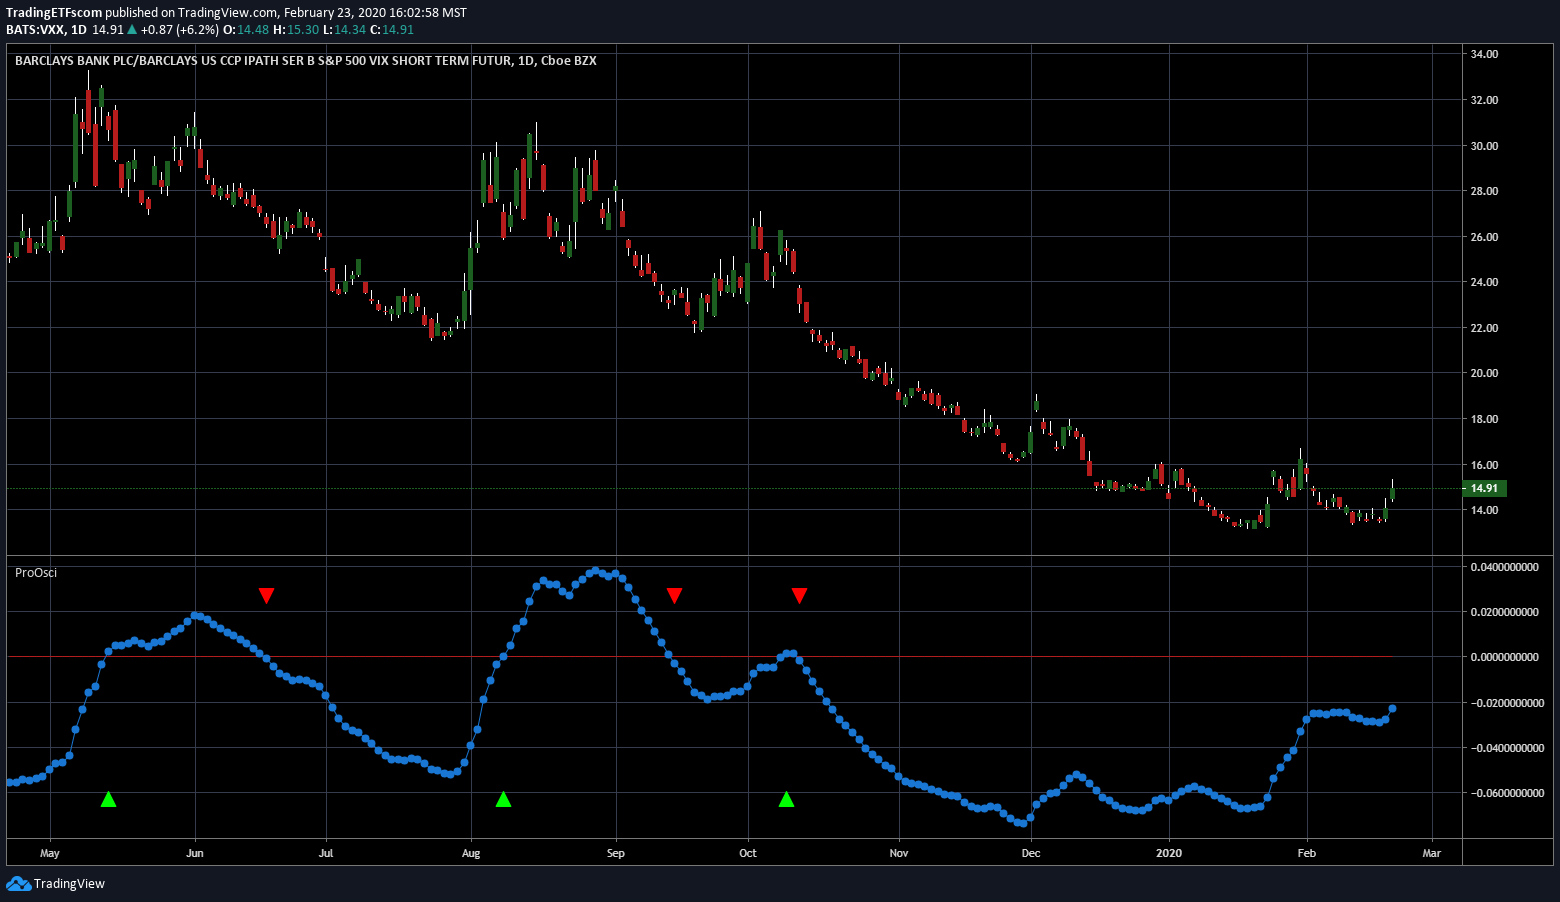
You can see the price chart on the top section that shows the lack of concern in the VXX ETF and the market in general. Right below you can see our Proprietary Oscillator with Blue Dots that has pretty much mirrored the price chart above but with one big difference. Notice that the price since the January 2020 high is lower today in February 2020 but the Oscillator below shows the Blue Dots just above the level seen in January 2020. This is a divergence or an abnormal occurrence relative to the rest of the previous time frames in the chart. You may be saying “so what, it’s a small divergence” and looking at that chart we could agree. What we like to do from time to time is to overlay our Oscillator on top of the price chart to see if it changes our opinion of the chart.
Is A Picture Really Worth A Thousand Words?
Let’s look at the chart below and see if you change your opinion of the above chart.
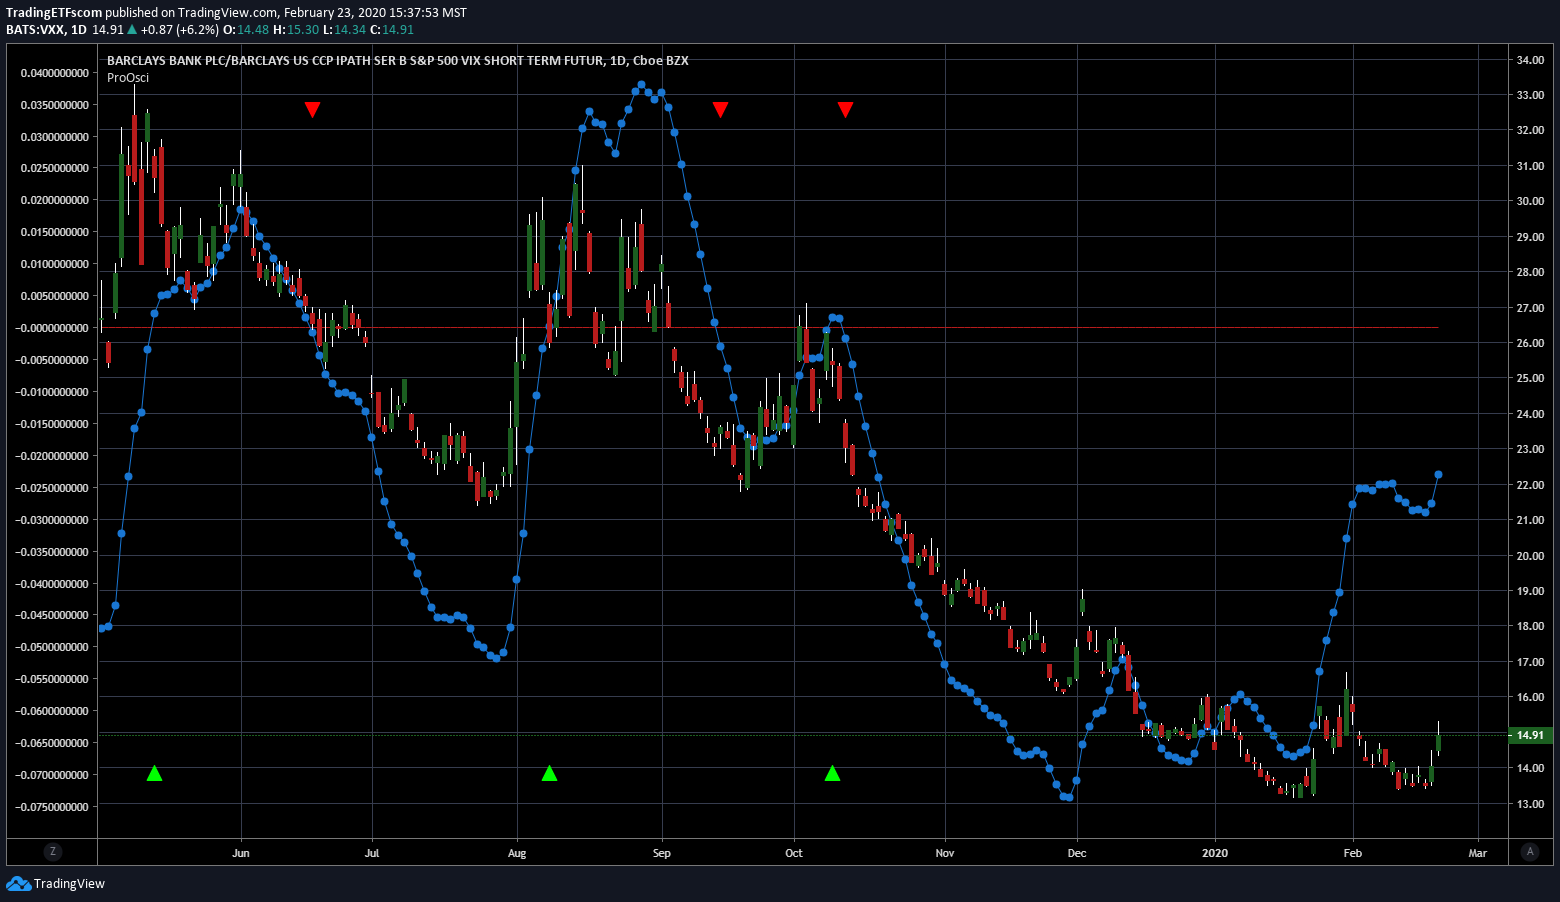
Did you change your mind from the previous chart? For the most part, the chart going back to May of 2019 has pretty much been lock step between price and the Oscillator right up until the last few days. What’s changed in the last few days? Here’s one big change as reported here: news.google.com (Apple warns) and another one here: Reuters.com (Samsung South Korea closes for just a few days?). If you haven’t read our previous article on the SMH ETF then just click here TradingETFs.com/SMH. One last link that is really lurking underneath the surface for contagion potential: Armstrongeconomics.com/blog.
The above links are specific stock market news links that are starting to cause concern amongst Traders/Investors but we can’t forget the other big news events like this: CNBC.com as politics are starting to play a big factor for the next 9 months.
These issues are all starting to build and that is why we are possibly seeing the VXX ETF getting ready for a big move imminently. We ask you again, Is a Picture Really Worth A Thousand Words?
What Do Other Volatility Indices Show?
The VIX Index below is showing a divergence as well although it is not as obvious as the VXX ETF. You can view the profile of the VIX Index here: CBOE.com Take a look at the next chart and you will see something very interesting about this chart.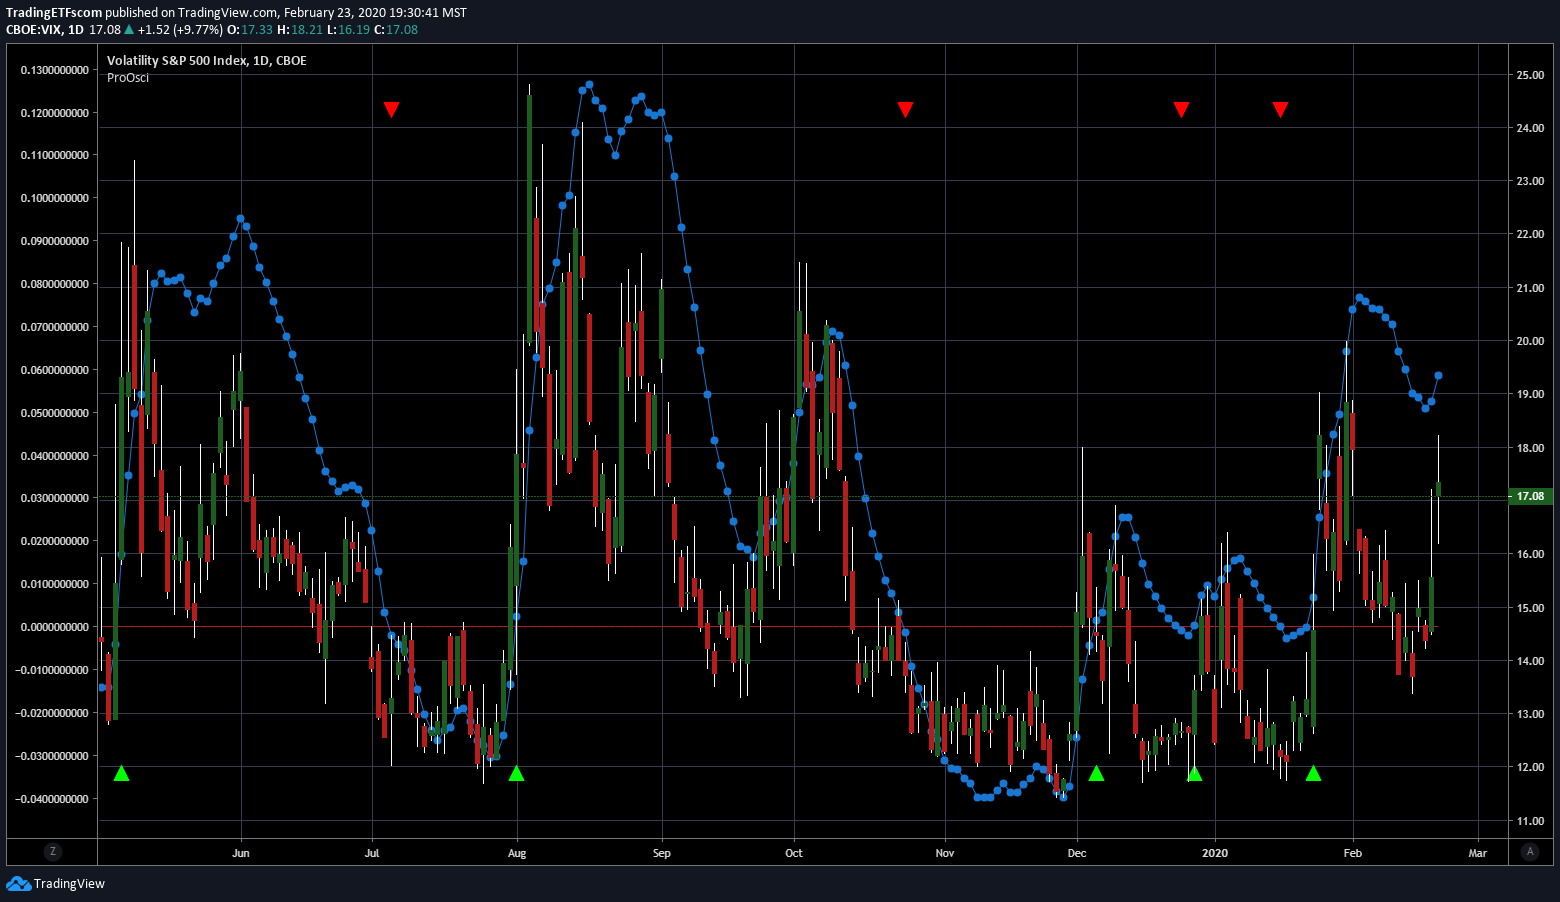
The chart above has our Oscillator on top of the price chart so let’s look at the Oscillator below the price chart to see if we can spot any other interesting information.
Notice that when we drop the Oscillator down below the price chart you can see in the circled area that the Blue Dots are above the red line. The red line is the zero line which means that momentum is positive and has officially given a Buy signal back in late January 2020. The fact that the Oscillator moved up above the zero line and then pulled back into February and now turning up is a very strong confirmation of what the VXX ETF is suggesting. We now have a second Volatility measurement pointing to an explosive move to the upside.
A Pattern Is Showing Up Among The Volatility Indices
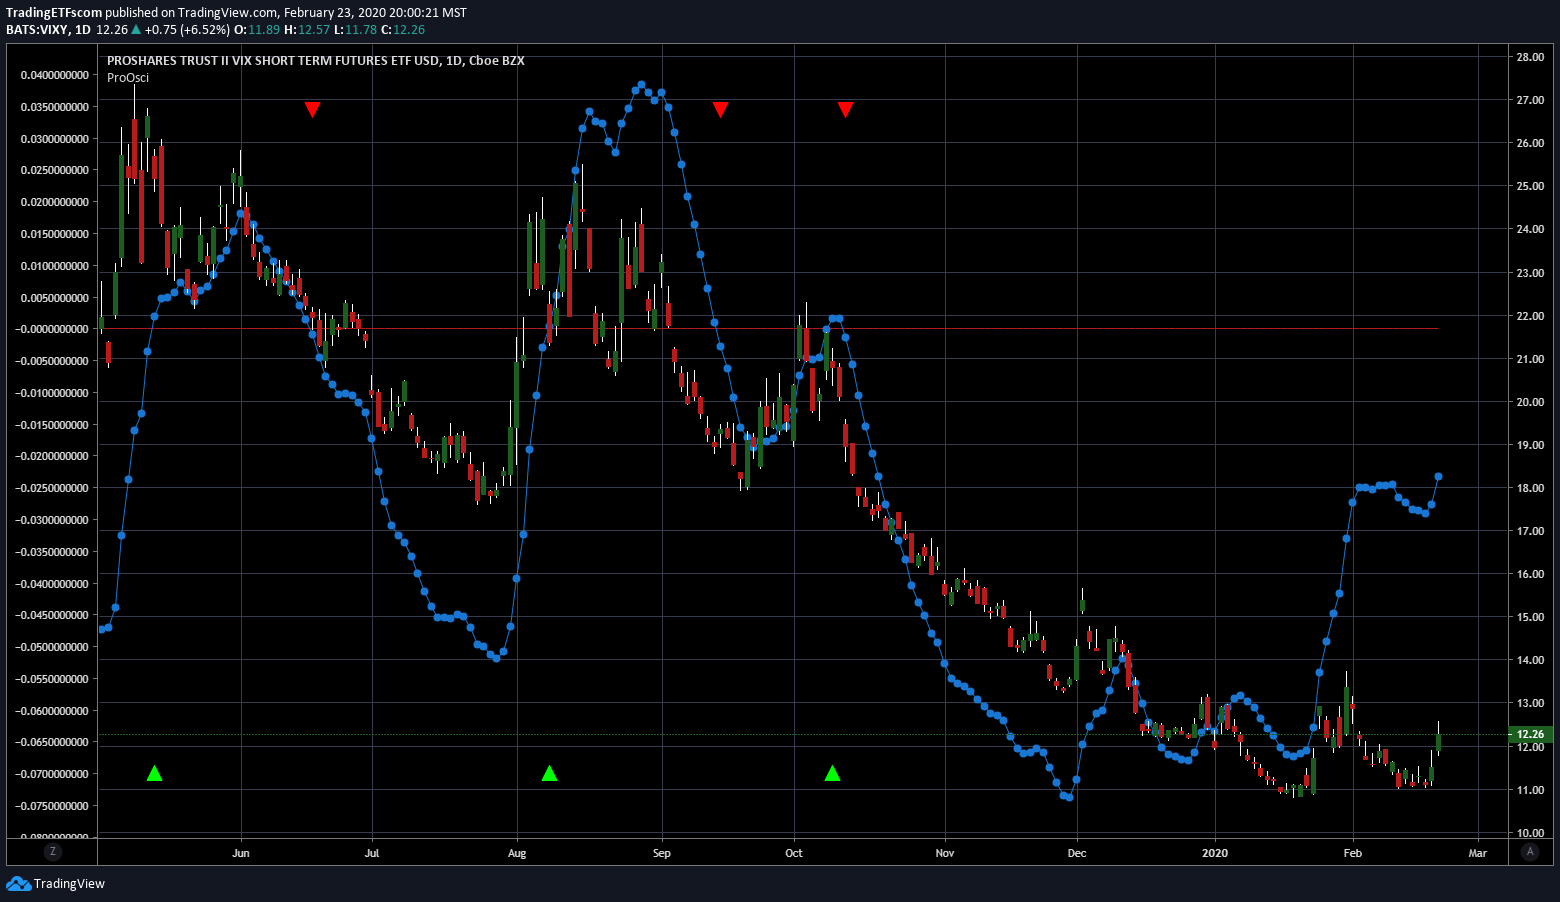
Another Volatility ETF is VIXY, the Proshares VIX Short-Term Futures ETF and you can see the profile here: ETFdb.com The chart below is again showing the Oscillator over lapping the price chart and it’s the same picture as the VXX. Take a look below:
From our perspective it looks as if volatility is here and Trading ETFs While Volatility Explodes Higher is to be considered. Let’s look at one last piece of the puzzle to sum this all up for you.
One Last Piece of the Puzzle
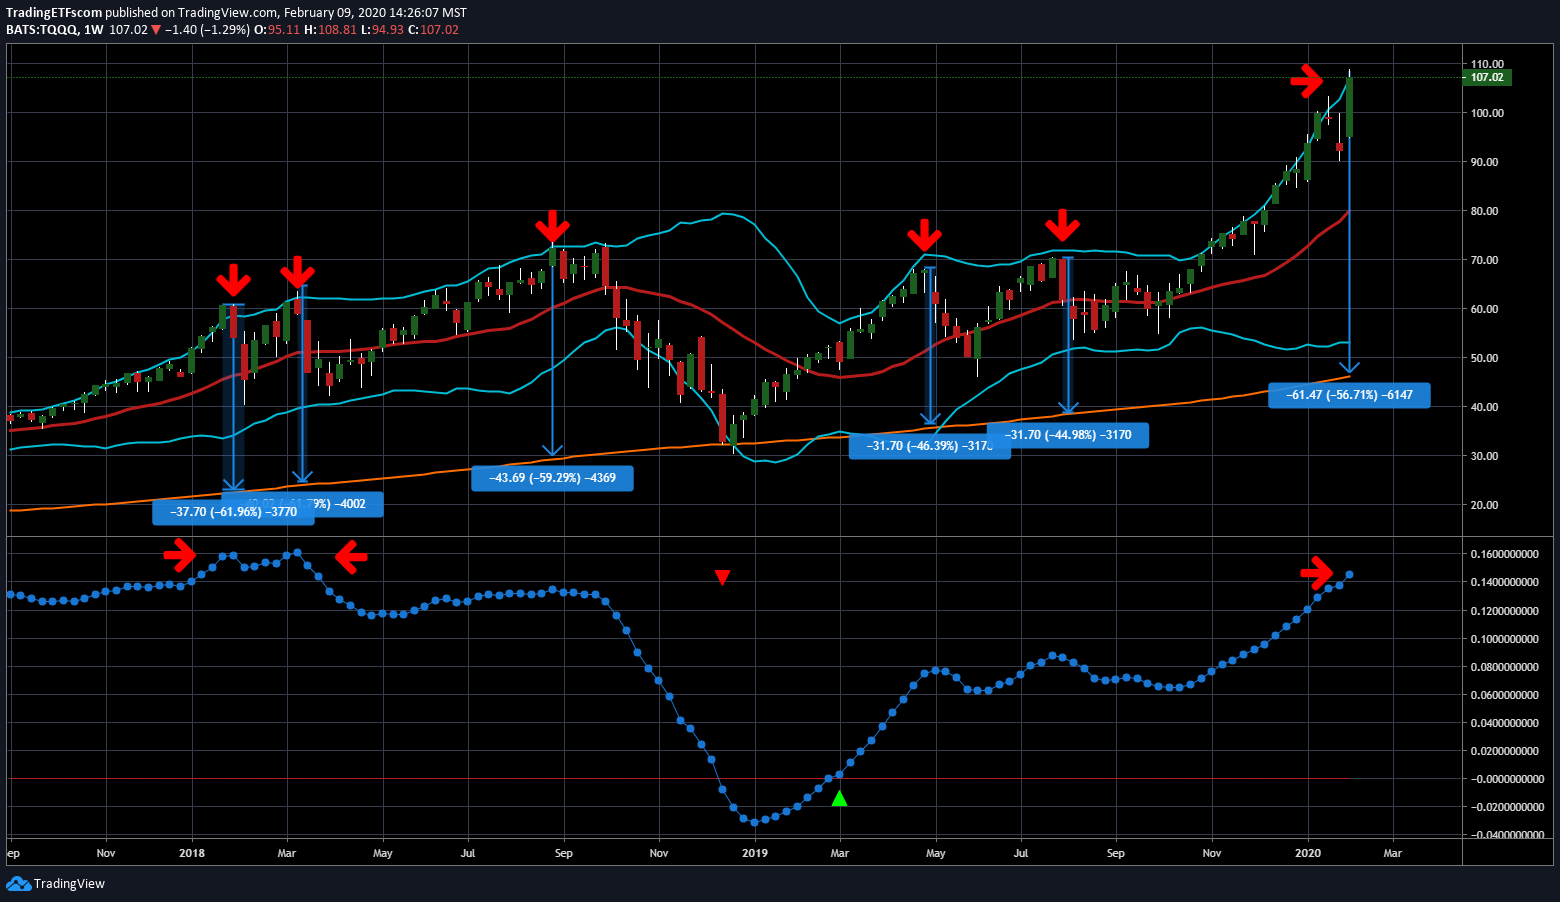
We wrote an article back on February 10, 2020 and you can click to read it here: How To Avoid Big Losses Trading ETFs like TQQQ. We discussed another method we use to measure extreme lack of concern with the before and now price movement. If you dig a little deeper into the ETF you will see that Apple (AAPL) is one of the top 10 holdings. Here is the before:
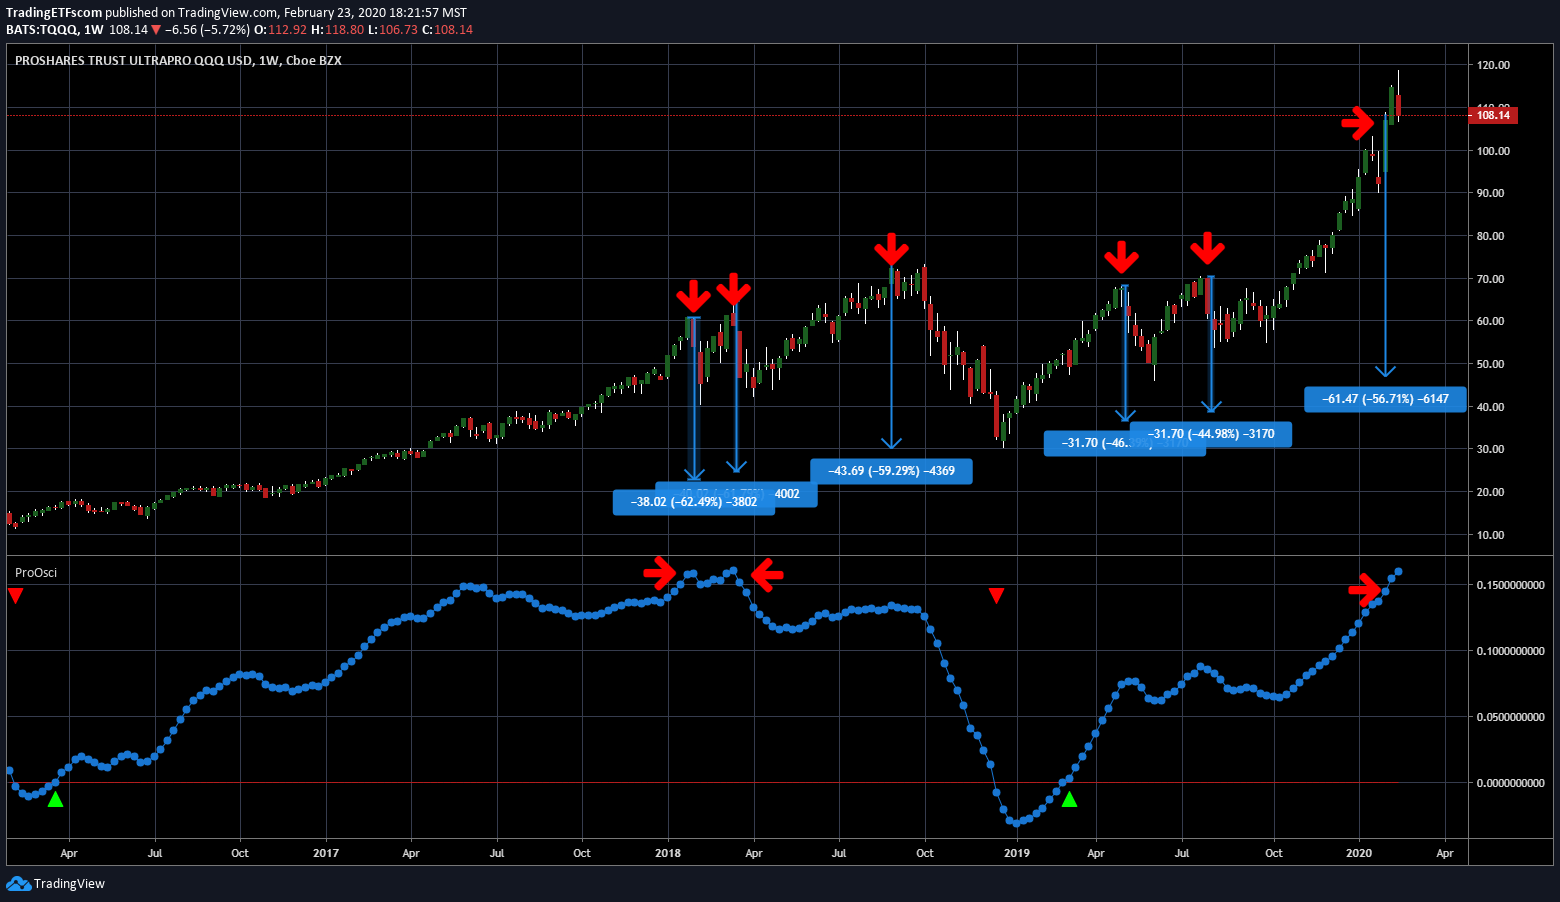
And here is the after:
What Is Our Takeaway From All Of This?
Our first take is that the market has been very complacent with risk in the stock market and Traders/Investors have been willing to risk their capital without fear of the market going down. We notice that our Oscillator was showing a big divergence to the upside versus the price. Other Volatility measurements are also confirming this. We linked a number of news events that have contributed to the realization that their is real risk in the market even though everyone believes these are temporary hiccups.
The TQQQ ETF is showing a pretty ugly reversal from the chart we posted a few weeks back. The SMH ETF seems to be an accident waiting to happen from our previous article and now real cracks are starting to show. Our final takeaway from all of this is that many Traders/Investors are going to be tested in a very nasty way but hopefully you will look to do your own confirmation of all this information so that you stay informed about what seems to be coming.
We also hope that we have provided additional information to help you with your Trading ETFs While Volatility Explodes Higher.

