The inverted yield curve is one of the more reliable recession indicators.
I discussed it at length last December. At that point, we had not yet seen a full inversion. Now we have, and it appears the curve was “inverted” back then, and we just didn’t know it.
The Powell Fed spent 2018 gradually raising rates and reducing the balance sheet assets it had accumulated in the QE years.
This amounted to an additional tightening. In fact, the balance sheet reduction may have had more impact than lower rates.
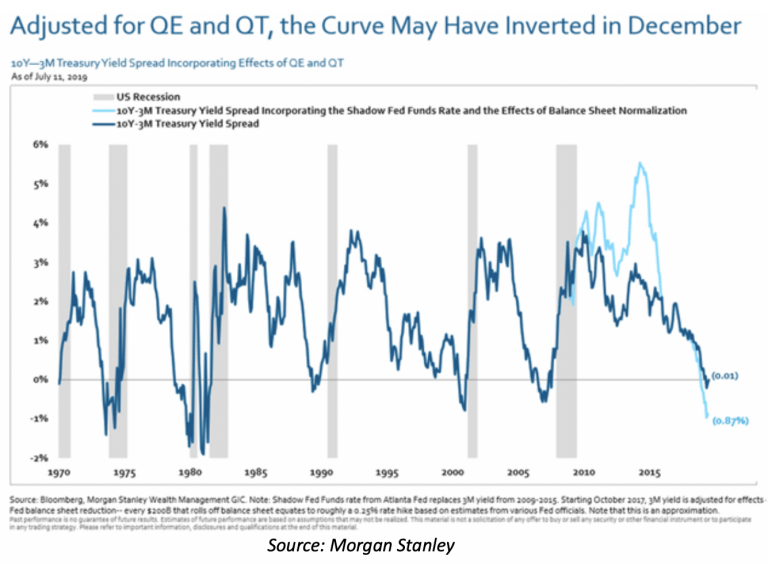
Now if you assume, as Morgan Stanley does, every $200B balance sheet reduction is equivalent to another 0.25% rate increase, which I think is reasonable, then the curve effectively inverted months earlier than most now think.
Worse, the tightening from peak QE back in 2015 was far more aggressive and faster than we realized.
Worrisome Charts
Let’s go to the chart below. The light blue line is an adjusted yield curve based on the assumptions just described.
But even the nominal yield curve shows a disturbingly high recession probability. Earlier this month, the New York Fed’s model showed a 33% chance of recession in the next year.


