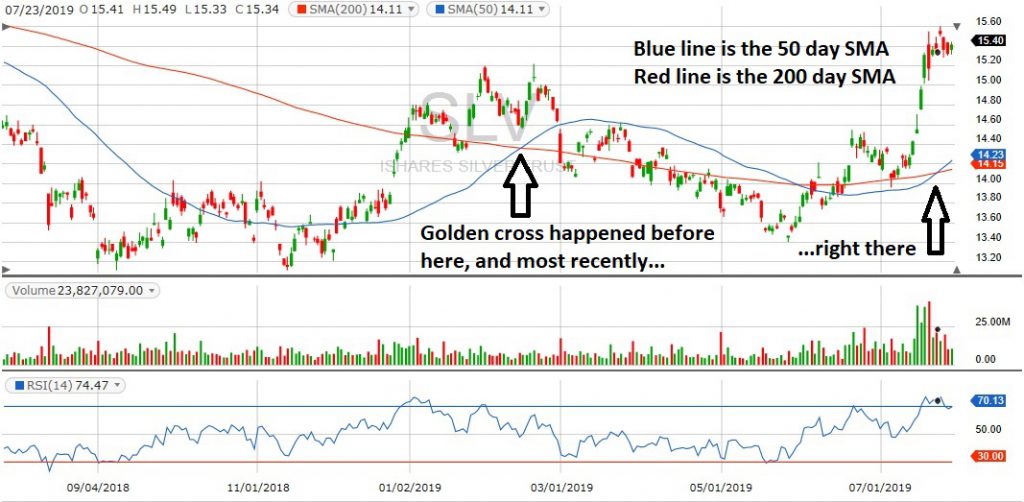
As regular Gold Enthusiast readers know, a golden cross is a technical chart pattern that happens when the 50-day SMA crosses up through the 200-day SMA. As the chart shows, silver had a golden cross once this year already on Feb 13th, and now again on July 23rd. Golden crosses are typically positive signs, and this one is backed up by big recent volume during an up phase, indicating traders are once again interested in silver. That’s a big positive.
The other big – nay, huge – positive is the Fed probably announcing a rate cut this week. Making such an announcement at a time when the US economy is firing on all cylinders indicates the US is committed to the race to the bottom in world currencies. Such races usually spur higher inflation, which is bullish for precious metals prices. And with silver prices still lagging far behind gold prices, silver looks ready to pick up its old mantle as the poor man’s gold.
Free charting lesson for the day: This chart illustrates an interesting point about SMAs, specifically the 50-day SMA (blue line). If prices for the thing being tracked by the SMA have a dip during the period of the SMA, the SMA may dip even after it has “risen up through resistance”. This is because it’s a mathematical construct and has to do what the math says, rather than thinking for itself.
Think of SMAs in terms of “digestion”. Digestion means each day the oldest price drops out of the SMA, and yesterday’s new price goes in. If the new prices going in keep being higher than the old prices dropping out, the SMA will continue to rise. Right now that’s clearly the case, but we’ll want to keep an eye on the 15.20 daily closing price. If silver drops below that the 50-day SMA might fall next. As the 200-day SMA is also rising right now, we’ll feel more comfortable when the two SMAs get some distance between them.
Signed,
The Gold Enthusiast
DISCLAIMER: No specific securities were mentioned in this article. The author is long the silver sector via small positions in PAAS, SVBL, and AGQ. He may sell the AGQ position if SLV closes below 14.95 for reasons mentioned in this article, but has no intentions of trading the other positions in the next 72 hours.
The iShares Silver Trust (SLV) was trading at $15.41 per share on Tuesday morning, up $0.01 (+0.06%). Year-to-date, SLV has declined -3.63%, versus a 12.94% rise in the benchmark S&P 500 index during the same period.
SLV currently has an ETF Daily News SMART Grade of C (Neutral), and is ranked #9 of 33 ETFs in the Precious Metals ETFs category.
This article is brought to you courtesy of ETF Daily News.
About the Author: Mike Hammer
 For 30-plus years, Mike Hammer has been an ardent follower, and often-times trader, of gold and silver. With his own money, he began trading in ‘86 and has seen the market at its highest highs and lowest lows, which includes the Black Monday Crash in ‘87, the Crash of ‘08, and the Flash Crash of 2010. Throughout all of this, he’s been on the great side of winning, and sometimes, the hard side of losing. For the past eight years, he’s mentored others about the fine art of trading stocks and ETFs at the Adam Mesh Trading Group.

