November: Fixed Income Update
- While October began with a fourth +75 bps Federal Reserve “Fed” rate hike, November also reported signs of moderating inflation, lower oil prices, and Fed comments that it will moderate its tightening policy starting in December.
- The turmoil in crypto, including the bankruptcies of FTX and BlockFi, while exposing the lack of financial oversight, and highlighting risk and uncertainty in that space, fortunately did not spill over into the improving outlooks for equity and credit markets.
- For the month, broad equities were +6% higher, Treasury yields fell, and spreads tightened in Investment Grade and Emerging Markets credit. High Yield spreads were mixed (Chart 1, Table 1).
- While Fed staff have communicated a “50-50” chance of recession in the U.S., a Bloomberg survey of economists pegs this probability at 63%.
November by the Numbers
Chart 1
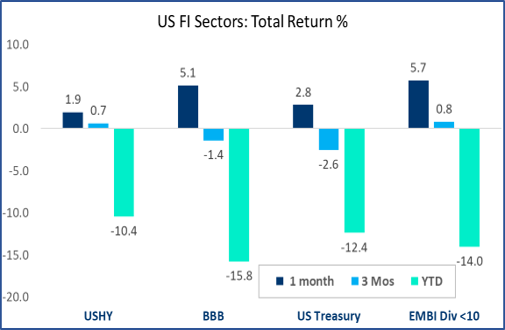
Chart 2
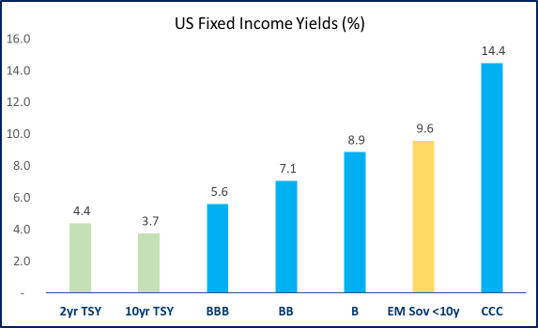
Table 1

Source: ICE Data Services, JP Morgan, Bloomberg, BondBloxx | Data as of 11/30/22
Fixed Income: U.S. Treasuries
- Key factors driving Treasury yields lower in November were a lower-than-expected CPI print for October, slowing PPI growth, continued signs of a weakening housing market, lower oil & gasoline prices, and the Fed’s reaction to this economic data.
- Subsequently, the Fed signaled that they will moderate the pace of policy rate increases to avoid overtightening, while stressing that borrowing rates will keep increasing and remain restrictive for some time and commented that the “path ahead for inflation remains uncertain.”
- The long-end of the yield curve rallied the most in November, with the benchmark 10-year bond yield falling nearly 45bps to 3.61%. The 2-year bond yield fell by 17bps to 4.31% (Chart 3, Table 2).
- The futures market is expecting the Fed target rate to reach its peak of 5.0% near the end of Q1 2023, after another +100bps of policy hikes over the next 3 to 4 Fed meetings (Chart 4).
Chart 3
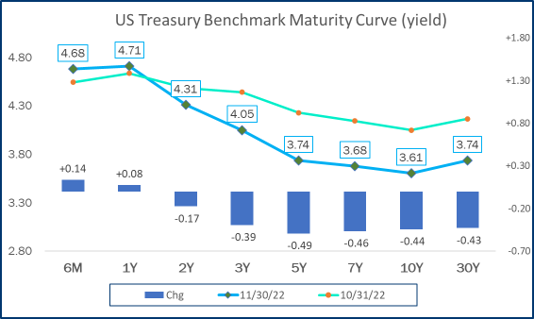
Chart 4
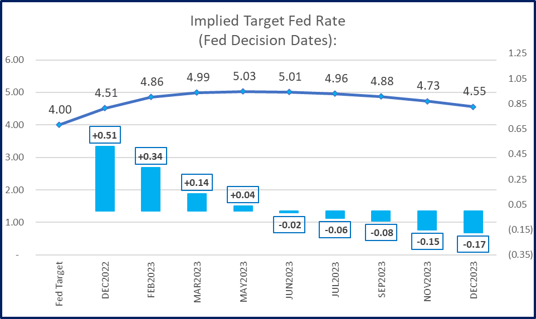
Table 2

Source: ICE Data Services, JP Morgan, Bloomberg, BondBloxx | Data as of 11/30/22
Fixed Income: Emerging Markets Debt
- The combination of an improving global inflation outlook, an expected moderation in Fed policy, and a weaker dollar (Chart 6) helped to drive Emerging Markets Debt (EM) higher in November (Table 3).
- EM dollar-denominated sovereign debt reported strong returns for the month, with the broad benchmark up +7.6%, while debt with maturities under 10-years rose +5.7% (Chart 5).
- Spreads tightened for EM debt across maturity and quality buckets, as EM debt with maturities <10 years tightening by 90 bps (Table 3).
- Year to date, EM debt with shorter maturities has outperformed broader EM debt by over 4.0% (Table 3).
Chart 5
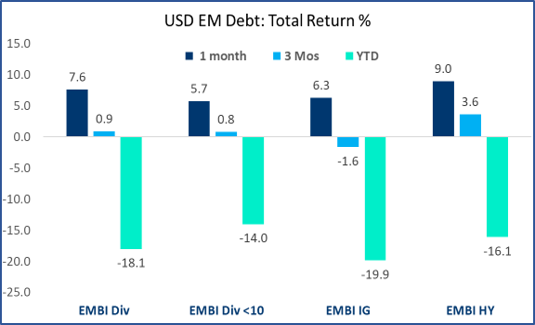
Chart 6
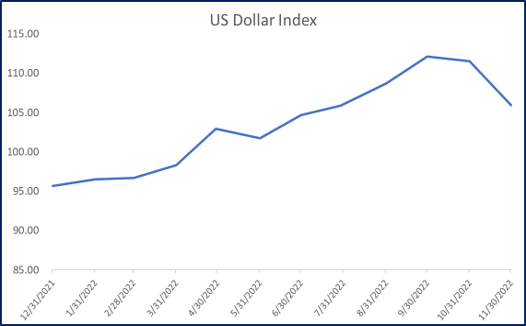
Table 3

Source: ICE Data Services, JP Morgan, Bloomberg, BondBloxx | Data as of 11/30/22
Fixed Income: U.S. High Yield Ratings
- High Yield performance was positive across all ratings buckets in October, with BBs leading the asset class with a +2.1% total return, compared to +2.0% for single-Bs and +0.7% for CCCs. (Chart 7, Table 4)
- Single-B and BB bonds benefited from strength in treasury bonds rates, signs of slowing inflation, and strong third quarter corporate earnings.
- Single-B and BB categories are nearly tied for year-to-date returns of -9.6% and -10%, respectively, while CCCs are down over 15% (Chart 7).
- Spreads for single-B and BB bonds were mostly unchanged as November returns reflected treasury gains, while CCCs widened by +32 bps for the month (Chart 8).
- As a reminder, market-cap weighted measures of U.S. High Yield are comprised approximately of 50% BB, 40% single-B, and 10% CCC (and lower) rated securities.
Chart 7
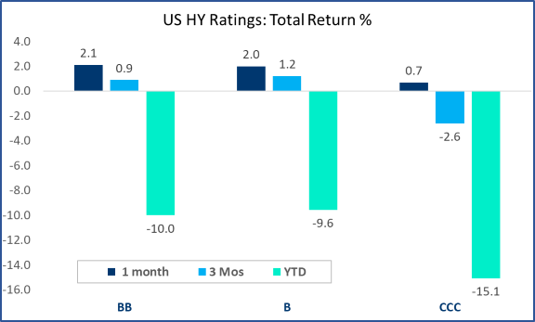
Chart 8
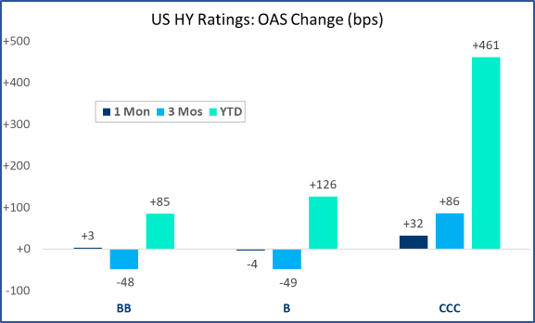
Table 4

Source: ICE Data Services, JP Morgan, Bloomberg, BondBloxx | Data as of 11/30/22
Fixed Income: U.S. High Yield Sectors
- High Yield (HY) reported a positive market return of +2.2% in November, with a range of 170 bps between the best and worst sectors. Year-to-date, there has been a 12% difference between the top performing sector (Energy) and the lowest performing sector (Healthcare) (Table 5).
- Bucking its 2022 trend, HY Healthcare outperformed in November, with strong returns by hospital company Community Health Systems (CYH) helping drive the sector +2.6% (Chart 9).
- The Telecom, Media, and Communication sector (TMT) lagged in November, with disappointing earnings from US cable and broadband operator Altice US (CSCHLD) helping to drive down sector results, +1.0% for the month. (Chart 9). HY Energy lagged as oil and gasoline prices fell.
- On a spread basis, Energy and TMT were wider, while the remaining sectors were flat to tighter (Chart 10, Table 5).
Chart 9
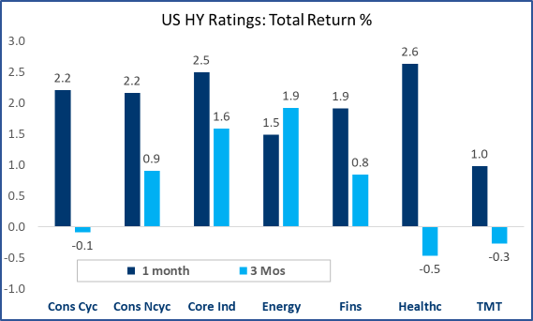
Chart 10
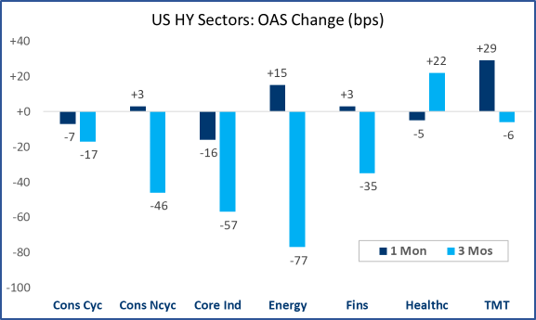
Table 5

Source: ICE Data Services, JP Morgan, Bloomberg, BondBloxx | Data as of 11/30/22
Carefully consider each Fund’s investment objectives, risks, charges, and expenses before investing. This and other information can be found in each respective Fund’s prospectus or, if available, the summary prospectus, which may be obtained by visiting bondbloxx.com. Read the prospectus carefully before investing.
There are risks associated with investing, including possible loss of principal. Fixed income investments are subject to interest rate risk; their value will normally decline as interest rates rise. Fixed income investments are also subject to credit risk, the risk that the issuer of a bond will fail to pay interest and principal in a timely manner, or that negative perceptions of the issuer’s ability to make such payments will cause the price of that bond to decline. Investing in mortgage- and asset backed securities involves interest rate, credit, valuation, extension and liquidity risks and the risk that payments on the underlying assets are delayed, prepaid, subordinated or defaulted on.
Distributor: Foreside Fund Services, LLC.
BondBloxx Investment Management Corporation (“BondBloxx”) is a registered investment adviser. The content of this presentation is intended for informational purposes only and is not intended to be investment advice. Not for distribution to the public.
Nothing contained in this presentation constitutes investment, legal, tax, accounting, regulatory, or other advice. Information contained in this presentation does not constitute an offer to sell or a solicitation of an offer to buy any shares of any BondBloxx ETFs. The investments and strategies discussed may not be suitable for all investors and are not obligations of BondBloxx.
Decisions based on information contained in this presentation are the sole responsibility of the intended recipient. You should obtain relevant and specific professional advice before making any investment decision. This information is subject to change without notice.
BondBloxx makes no representations that the contents are appropriate for use in all locations, or that the transactions, securities, products, instruments, or services discussed are available or appropriate for sale or use in all jurisdictions or countries, or by all investors or counterparties. By making this information available, BondBloxx does not represent that any investment vehicle is available or suitable for any particular investor. All persons and entities accessing this information do so on their own initiative and are responsible for compliance with applicable local laws and regulations.
Bond ratings are grades given to bonds that indicate their credit quality as determined by private independent ratings services, such as Standard & Poor’s, Moody’s and Fitch. These firms evaluate a bond issuer’s financial strength or it’s ability to pay a bond’s principal and interest in a timely fashion. Ratings are expressed as letters ranging from ‘AAA’, which are the highest grade, to ‘D’, which is the lowest grade.
Index performance is not illustrative of fund performance. One cannot invest directly in an index. Please visit bondbloxx.com for fund performance.

