[ad_1]
In recent months, everyone has been talking about FAANGs. And with good reason. By market value, the so-called FAANGs—Facebook, Apple, Amazon, Netflix and Google (now Alphabet)—represent nearly 15% of the S&P 500 today.
These massive companies make massive headlines, and trigger significant market movement on any given day. Consider Facebook, for example. Shares of the company dropped some 20% on July 26, the steepest one-day drop ever of a U.S.-listed stock, bringing Facebook down about 1% year-to-date. That large drop dragged down other companies with it, especially social media rivals.
Apple, meanwhile, is in the news as the first U.S. company to hit $1 trillion in market capitalization this week. Apple stock is up 23% year-to-date, up 8.6% in the past two days alone.
Netflix stock—brace yourself—is up a whopping 78% so far in 2018. Amazon is not far behind, with gains of more than 56% year-to-date; Google is up 17%. Aside from Facebook, these FAANGs are seeing meteoric rises considering that the S&P 500 as a whole is up only about 6% in the same period.
Different Ways To Catch Returns
If you are a passive investor using ETFs, chances are you are capturing all of this action. But to what degree depends on the vehicle of choice.
If you worry FAANGs are bringing too much single-stock risk—up or down—into your diversified portfolio, you may be right if you own a market-cap-weighted ETF that tracks the S&P 500 or a similar index of U.S. stocks. You own the market as it is, as they say. And that’s what passive investing is about.
If FAANGs are doing well, they can disproportionately drive your returns higher due to their sheer size alone. Market-cap weighting looks great when that’s the case. You capture that price leadership in full. If they are down, however, the same is true: They can really drag down your overall results.
One way to address portfolio exposure to some of these massive market-moving securities is by looking at passive ETFs that access the market through different weighting schemes. There’s no right or wrong choice here, only the choice that best fits your risk tolerance and your overall goals.
Alternative Weightings
The cool thing about the ETF market is that there are plenty of choices. If worrying about a handful of mega-cap stocks isn’t for you, passive ETFs that adopt other weighting schemes can be an alternative.
The entire smart-beta phenomenon is predicated on the notion that you can be a passive investor and still seek different—not necessarily better—risk-adjusted returns. With smart-beta ETFs, you have access to the same underlying securities, but you are making some bets or adopting some tilts that mitigate one thing or another, or tap into one thing or another—same ingredients in the basket, different recipe.
One of the oldest and simplest approaches to dealing with the fact that the biggest companies have the most impact in market-capitalization-weighted portfolios is equal weighting.
There are 104 equal-weighted ETFs on the market today tapping into various pockets of the market. The biggest, the Invesco S&P 500 Equal Weight ETF (RSP), goes toe-to-toe with the SPDR S&P 500 ETF Trust (SPY).
Difference In Returns
RSP has $15.5 billion in total assets. SPY has $270 billion in total assets. Both offer direct, transparent, easy-to-trade access to the companies in the S&P 500. But by adopting different weighting schemes—one equal-weighting each security, the other a market-cap-weighted portfolio—these ETFs often deliver different returns.
Year-to-date, SPY is outpacing RSP by about 1.5%. Why? Because FAANGs are by and large leading the way this year, driving S&P 500 returns. In a market when a handful of big stocks lead, a market-cap-weighted portfolio can do better due to its larger allocation to these securities, as opposed to an equal-weighted portfolio that minimizes the impact of a single stock.

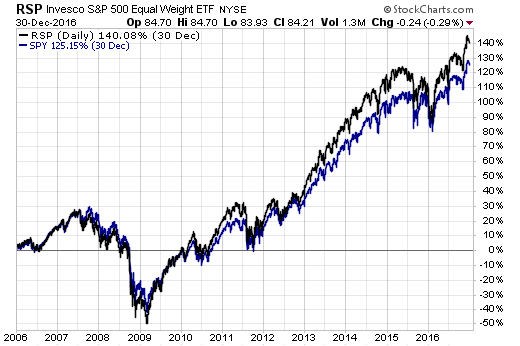
In 2017, SPY again outperformed RSP, by about 3%. But in 2016, it was RSP that led the way, delivering 14.5% in returns versus SPY’s 12%. In fact, if you owned RSP for the 10 years between 2006 and 2016, you outperformed SPY by a solid 15%:

Charts source: StockCharts.com
[ad_2]
Source link

