[ad_1]
With oil prices dropping, it’s a good time to be invested in refiners.
Over the past month, oil and gas equipment and services ETFs have made up three of the five top-performing funds (the InfraCap MLP ETF (AMZA) deals with energy master limited partnerships, a related segment):

Sources: ETF.com, FactSet; data as of Jan. 31, 2019
In fact, energy services ETFs are vastly outperforming energy ETFs, which have struggled over the past month given the backslide in crude oil prices over the same time period.
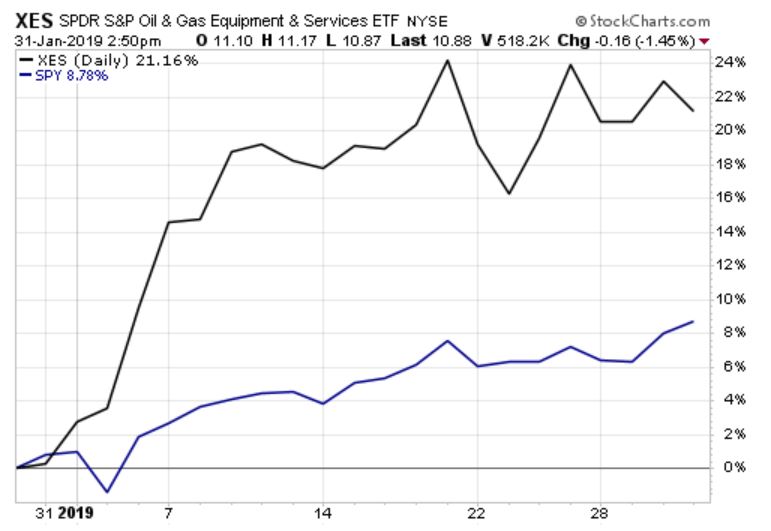
Of all the oil services ETFs burning up our charts, the best-performing is the $210 million SPDR S&P Oil & Gas Equipment & Services ETF (XES), which is up 20.6% over a one-month period. That’s why we’ve made it our pick for ETF of the Week.

Source: StockCharts.com; data as of Jan. 31, 2019
Refiners, Pipelines Benefit When Crude Slides
Over most of 2018, oil rebounded considerably from the previous year, hitting the $70s/barrel by summer. But by December, oil prices had once again begun to fall, as rising U.S. stockpiles and falling economic sentiment helped depress demand.
It may seem counterintuitive, but refiners and other services companies actually benefit from falling oil prices. Refiners have to purchase crude to supply their factories, so lower oil prices mean higher margins for them.
Meanwhile, pipeline companies benefit from the volume of oil that passes through their infrastructure; lower oil prices more crude oil flows.
Furthermore, equipment sellers can benefit from a slide in oil prices, as wildcatters often take that opportunity to pause their exploratory activities to upgrade equipment and better position themselves for a pricing rebound.
XES tracks oil and gas equipment and services companies. Just over half (53%) of its holdings are in oil-related services and equipment companies, while another quarter are in drilling hardware and services. The top three stocks in XES are Weatherford International (WFT) (4%), McDermott International (MDR) (4%) and Rowan Cos Plc (RDC) (3%).
XES’ Secret Sauce: Equal Weighting
Equal-weighted XES carries a small-cap tilt that sets it apart from its competition. Whereas XES’ main competitors, the $1.1 billion VanEck Vectors Oil Services ETF (OIH) and the $182 million iShares U.S. Oil Equipment & Services ETF (IEZ), allocate roughly 20% of their portfolios to the drilling heavyweight Schlumberger (SLB), XES gives the firm just a 3% weight.
Overall, XES’ portfolio has a weighted average market cap of $4.9 billion, compared with OIH’s $18 billion average market cap. XES also has more names in its portfolio than OIH (36 holdings to OIH’s 23), resulting in a more diverse take in a field of relatively top-heavy products.
With an expense ratio of 0.35%, XES costs the same as OIH, the segment’s heavyweight. It is also fairly liquid, with strong average volume ($19 million traded daily) and relatively tight spreads of 0.10%.
Contact Lara Crigger at [email protected]
[ad_2]
Source link

