[ad_1]

(Pic Sourced Here)
Now that more than two-thirds of the S&P 500 components have reported their earnings, we’re stuck in the latter half of the earnings season which can feel like an absolute slog for ETF strategists and investors looking to make a move on a big report. Why should an ETF strategist care about earnings? Because most ETFs are market-cap weighted – meaning the bigger the stock, the bigger the potential move for an ETF with a big position – and with most of the mega-cap tech stocks at the top of the S&P having already reported, we’re left with the smaller names in the equally small sectors to deliver some media-worthy moments.
Fortunately, there are plenty of names to watch this week but we’re focusing on a host of “tiny” utility and real estate names that could impact a major ETF trend, the strong performance by low volatility smart beta ETFs that have been crushing it in 2019.

And why these stocks? Because while their market cap may be small, they’re big parts of one of the strongest low vol performers, the Invesco S&P Low Volatility ETF (SPLV), which is up over 8% this year and now just half a percent off its 52-week high. This is something those high-flying tech funds, including IGV that we discussed last week, can’t claim. While their percentage returns aren’t mind-blowing, our own Quant system has SPLV and a host of other low vol funds showing momentum scores near their historical peaks, but with great performance comes great risk and like Icarus, SPLV might be flying too high for its own good thanks to a dependency on two sectors.
Low Vol Chartology
First, why are we focusing on SPLV rather than its larger and perhaps better-known rival, the iShares Edge MSCI Min Vol USA ETF (USMV), which is also up strongly this year? We can learn a lot (and you will) from studying their differences but for the purposes of technical analysis, SPLV is the fund to watch.
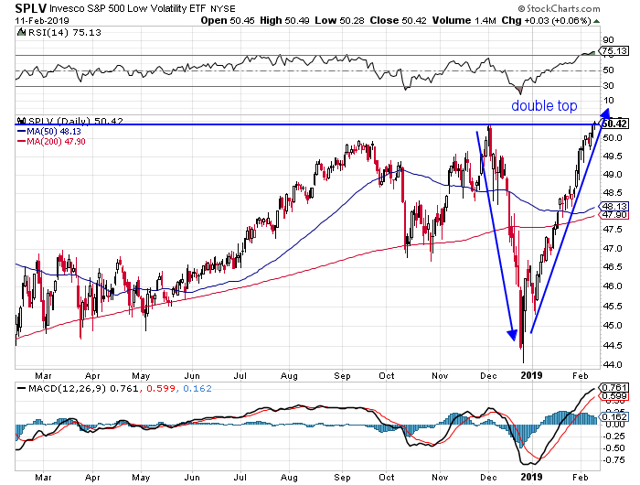
Take a look at this short-term chart of SPLV where you can see that the fund has a steep V-shaped pattern showing a sharp recovery, following an equally sharp sell-off that’s brought the fund all the way back to its starting point with hardly a brief pause along the way! In fact, the recovery was both so rapid and powerful that there was never a crossover of the 50- and 200-day moving averages (DMA), a common sell signal and something most defensive sector ETFs, but not the broader market replicators, can claim.

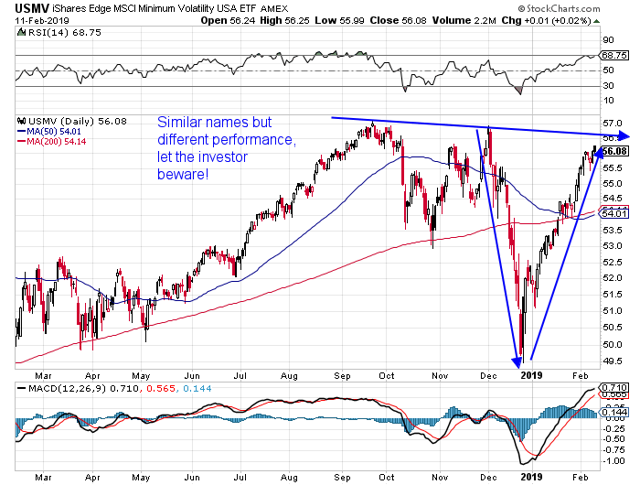
Nor can USMV which not only suffered a MA crossover but remains substantially below both its 52-week high set in September as well as the downtrend line connecting the highs from September and December. But SPLV has also seen its 14-day RSI score cross over into overbought territory while the MACD score shows signs of flagging. Meanwhile, USMV has a similar, but not identical pattern to share.

Both have mandates to seek out lower vol stocks and similar sounding names, but SPLV and USMV have substantially different benchmarks and internal construction which result in similar, but not identical, performance and technical outlooks. For investors thinking that all low vol funds are nothing but utilities or consumer staples, think again.
Pull it apart and put it back together
The heart of their performance differences come from where they draw their investments and the complexity of their strategies where SPLV is far easier to understand. It builds out a portfolio using the 100 S&P 500 components with the lowest realized volatility over the preceding 12 months and weights the individual positions by the inverse of their volatility. The net effect is more akin to an equally weighted portfolio which combined with a disregard for the shift in sector weightings relative to the S&P 500 means you have a portfolio where smaller utilities and REITs can really shine. Just how much is almost hard to believe, with both sectors consistently making up more than 20% of SPLV versus around 3% to 3.5% of the S&P 500.
When investors are locked into a defensive mode that can lead to serious gains like in 2019, thanks to the fact that SPLV is often one of the largest holders of these smaller stocks. Case in point is CB Richard Ellis (CBRE), one of the largest real-estate management and investment companies in the world and a mere .06% of the S&P 500. However, it’s a .95% holding in SPLV which makes it one of the largest ETF owners of the stock outside of a specialty REIT fund and a major beneficiary of CBRE’s 15% plus return in 2019. The same is true for several REITs reporting this week including Vornado Realty Trust (VNO) and Federal Realty Investment Trust (FRT), both up double-digits this year and which count SPLV as one of their biggest holders. USMV, on the other hand, only has FRT and with a weighting just 1/3rd that of SPLV.
But USMV also has a much more balanced strategy that prevents it from deviating too far from the sector weights of its reference index. The fund pulls from the broader MSCI USA Index and has twice as many holdings as SPLV, reducing the amount of overlap, but also builds its portfolio using different constraints. Rather than focusing on just realized volatility, USMV’s benchmark is concerned with optimizing a portfolio with the lowest possible risk but considers individual stock correlations and not just total, realized volatility. There are also limits on both individual weights and the differences between the fund and MSCI USA’s sector weights that give it a much more benchmark-like feel. It still has more utilities and REIT exposure versus a broad index fund than SPY, but way less than you’ll find in SPLV.
Think about it like this; if SPLV can be considered a stealth REIT/Utilities fund, USMV is one that any asset allocator could feel comfortable, including in a more balanced role and largely because of how those defensive holdings perform over the long run. Both funds having high cyclicality and similar performance compared to other large core funds, but SPLV stands out once again thanks to a more permanent defensive orientation despite four reconstitutions a year. In other words, both funds will zig when the market zags, but one will do a lot more zigging than the other.
If you looked at Morningstar’s performance rankings, SPLV generally ranks in the top or bottom decile (10%) of “large blend” funds because of those utility and REIT stocks which give it a higher correlation to a REIT index than to the S&P 500, hence the need to keep a close eye on REIT stock earnings. Meanwhile, USMV has a higher correlation to the S&P 500, despite drawing its holdings from a broader index, but also has a lower overall standard deviation and higher return than SPLV over the last three years which is why someone focused on asset allocation rather than market timing might prefer it to SPLV.
Conclusion
One week of earnings may not be enough to shift the story on SPLV, but in the short term, the question remains that with the fund running into a double top at old highs, thanks to strong REIT/utility performance, does it still have the juice to break out to new highs or will it fall back to support both at $49.50 and $48.50?
The longer-term question investors need to be asking themselves is this; do they have enough faith in those defensive sectors, or in their own judgements of the market’s weakness, to bet the farm on SPLV?
Disclosure: I/we have no positions in any stocks mentioned, and no plans to initiate any positions within the next 72 hours. I wrote this article myself, and it expresses my own opinions. I am not receiving compensation for it (other than from Seeking Alpha). I have no business relationship with any company whose stock is mentioned in this article.
Additional disclosure: Assumptions, opinions and estimates constitute our judgment as of the date of this material and are subject to change without notice. ETF Global LLC (“ETFG”) and its affiliates and any third-party providers, as well as their directors, officers, shareholders, employees or agents (collectively ETFG Parties) do not guarantee the accuracy, completeness, adequacy or timeliness of any information, including ratings and rankings and are not responsible for errors and omissions or for the results obtained from the use of such information and ETFG Parties shall have no liability for any errors, omissions, or interruptions therein, regardless of the cause, or for the results obtained from the use of such information. ETFG PARTIES DISCLAIM ANY AND ALL EXPRESS OR IMPLIED WARRANTIES, INCLUDING, BUT NOT LIMITED TO ANY WARRANTIES OF MERCHANTABILITY, SUITABILITY OR FITNESS FOR A PARTICULAR PURPOSE OR USE. In no event shall ETFG Parties be liable to any party for any direct, indirect, incidental, exemplary, compensatory, punitive, special or consequential damages, costs, expenses, legal fees, or losses (including, without limitation, lost income or lost profits and opportunity costs) in connection with any use of the information contained in this document even if advised of the possibility of such damages.
ETFG ratings and rankings are statements of opinion as of the date they are expressed and not statements of fact or recommendations to purchase, hold, or sell any securities or to make any investment decisions. ETFG ratings and rankings should not be relied on when making any investment or other business decision. ETFG’s opinions and analyses do not address the suitability of any security. ETFG does not act as a fiduciary or an investment advisor. While ETFG has obtained information from sources they believe to be reliable, ETFG does not perform an audit or undertake any duty of due diligence or independent verification of any information it receives.
This material is not intended as an offer or solicitation for the purchase or sale of any security or other financial instrument. Securities, financial instruments or strategies mentioned herein may not be suitable for all investors. Any opinions expressed herein are given in good faith, are subject to change without notice, and are only correct as of the stated date of their issue. Prices, values, or income from any securities or investments mentioned in this report may fall against the interests of the investor and the investor may get back less than the amount invested. Where an investment is described as being likely to yield income, please note that the amount of income that the investor will receive from such an investment may fluctuate. Where an investment or security is denominated in a different currency to the investor’s currency of reference, changes in rates of exchange may have an adverse effect on the value, price or income of or from that investment to the investor.
[ad_2]
Source link

