[ad_1]
(For more on how factor analysis can help you differentiate between ETFs, join us on Oct. 30 for the ETFs: See Clearly Through a Factor Lens webcast. The conversation, hosted by our own Dave Nadig, will include Tom Idzal, managing director at Style Analytics; and Ryan Issakainen, senior vice president, ETF Strategist at First Trust Advisors. You can register for this webcast here.)
Picking the right ETF has never been harder. With more than 2,000 ETFs to choose from, many investors end up taking the most cursory glance at what a fund promises, check for expense ratios and volumes, and pull the trigger. Maybe, if they are a more sophisticated ETF investor, they might hop over to something like our ETF Stock Finder and compare some basic measurements like P/E ratios and cap weights to look for differences.
Increasingly though, investors and advisors can look to specialized tools to help tease apart the real differences in exposure that ETFs—especially factor-based ETFs—are providing.
Many of these factors aren’t always explicitly stated in a fund’s objective. Think of it as looking under the hood through a factor lens to find out all the intended and unintended factor exposures in your equity ETF.
For example, consider two competing multifactor ETFs in the U.S. large-cap blend equity segment: the First Trust Large Cap Core AlphaDEX Fund (FEX) and the John Hancock Multifactor Large Cap ETF (JHML). Both these multifactor strategies comb through the large-cap space looking at various factors in an effort to outperform the broader market.
The first challenge investors face when choosing between these funds is one of nomenclature. What one person calls a multifactor ETF may not be the same to someone else. What collection of factors are in there? As Style Analytics’ Tom Idzal puts it, “The definition of multifactor has no approved ingredients inside.”
If you go granular in your due diligence and do some factor analysis in both these portfolios, you will quickly find their factor tilts are very different in three key ways: relative to each other; relative to the broad U.S. large-cap blend segment (which includes some 638 different funds and ETFs, according to Morningstar’s definition); and relative to the benchmark; in this case, the MSCI USA universe.
Here’s what that looks like when we dig deeper into just one of several factors:
Value Note
- The bigger light blue box represents the entire U.S. large-cap blend fund universe (638 different strategies)
- The Zero line represents the benchmark—the MSCI USA
- The yellow square is FEX
- The red triangle is JHML

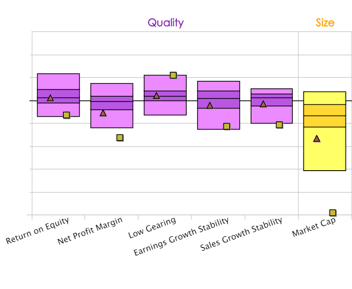
What this graph tells us is that FEX tilts more toward value as measured by five common value measurements than competing JHML (the red triangle), and even more than most of the other funds in the entire universe (the large blue box.) From a cash-flow yield perspective, it’s literally the “value-est” you can get—and it’s not even making an explicit value claim.
The trade-off of course is that there are other notable factor bets. The fund tilts to smaller-caps in a notable way. Look at that yellow square under size—it’s practically off the chart. The average market cap of FEX is much lower than the benchmark, and much lower than competing JHML and the competing entire large-cap blend universe.
“If you’re getting involved in this AlphaDex ETF, you have to realize you’re also getting a smaller-cap bias,” Idzal said. “If large-caps do really well, this could be an exposure that could hurt FEX, and vice versa.”

Data Source: Style Analytics
FEX also reaches deep into what some would consider “low quality” stocks for its small-cap value exposure, showing lower profitability and sales growth than some investors might be comfortable with—or that might be just the kind of value play you’re looking for.
These kinds of analysis aren’t always the easiest to do, and getting access to the right data can be tricky. But at the end of the day, it’s these kinds of exposures that determine your future returns—even more than expense ratios or trading volumes.
[Note: ETF.com Managing Director will be conducting a free in-depth webinar with Style Analytics on Oct. 30 if you’re interested in how to actually do this kind of analysis on your own. CE credits are available as always, and the discussion is sure to leave you with a few great ideas on how to conduct your own ETF due diligence. You can register here.]
Contact Cinthia Murphy at [email protected]
[ad_2]
Source link

