[ad_1]
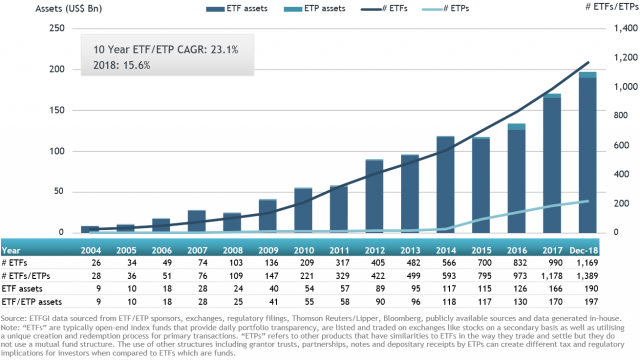
ETFGI, a leading independent research and consultancy firm on trends in the Asia Pacific (ex-Japan) ETF/ETP ecosystem, reported today that that assets invested in ETFs and ETPs listed In Asia Pacific (ex-Japan) reached a record high of US$197 billion at the end of December 2018, surpassing the previous record set at the end of the previous month, according to ETFGI’s December 2018 Asia Pacific (ex-Japan) ETF and ETP industry insights report, an annual paid-for research subscription service. (All dollar values in USD unless otherwise noted.)
Highlights
- Assets invested in ETFs/ETPs listed In Asia Pacific (exJapan) increased by 2.9% during December 2018 to reach a record high of $197 Bn, beating the prior record of $191 Bn set at the end of November 2018.
- Yearto-date, assets have increased by 15.6% from $170 Bn at the end of 2017.
- In December 2018, ETFs/ETPs listed In Asia Pacific (exJapan) saw net inflows of $9.82 Bn.
According to ETFGI’s December 2018 Asia Pacific (ex-Japan) ETF and ETP industry insights report, an annual paid-for research subscription service, assets invested in ETFs/ETPs listed in Asia Pacific (ex-Japan) increased by 2.9% from $191 Bn at the end of November. Ove the year, assets have increased by 15.6% from $170 Bn at the end of 2017. At the end of December 2018, the Asia Pacific (ex-Japan) ETF/ETP industry 1,389 ETFs/ETPs, with 1,544 listings, from 142 providers on 17 exchanges.
“The end of 2018 saw the trend in developed markets reverse, and although arguably predictable, the severity left many pundits scratching their heads. This end of year stress has widely been attributed to the disruption caused by trade disputes feeding into economic data, and the view policy makers are not going to be quite as accommodating as initially expected. The S&P 500 returned -9.03% during December, and down -4.38% for 2018. Developed markets ex-US fell -4.62% during December, led by Japan and Canada, bringing the yearly return to -13.21%. Relatively speaking, EM and FM fared the month better, returning -2.68% and -3.15%, finishing 2018 -13.53% and -11.82%, respectively” according to Deborah Fuhr, managing partner and founder of ETFGI.
Asia Pacific (ex-Japan) ETF and ETP asset growth as at end of December 2018

In December 2018, ETFs/ETPs listed in Asia Pacific (ex-Japan) saw net inflows of $9.82 Bn. Equity products gathered the largest net inflows with $7.99 Bn, while active ETFs/ETPs experienced the largest net outflows with $183 Mn. For the whole of 2018, ETFs/ETPs listed in Asia Pacific (ex-Japan) have seen net inflows of $58.3 Bn. Equity products gathered the largest net inflows with $40.3 Bn, while currency ETFs/ETPs experienced the largest net outflows with $150 Mn.
A high proportion of net inflows can be attributed to the top 20 ETFs by net new assets, which collectively gathered $9.61 Bn. The Reliance CPSE ETF (CPSEBE IN) on its own accounted for net inflows of $2.34 Bn.
Top 20 ETFs/ETPs by net inflows during December 2018: Asia Pacific (ex-Japan)
|
Name
|
Country listed
|
Ticker
|
Assets
|
NNA
|
NNA
|
|
Reliance CPSE ETF
|
India
|
CPSEBE IN
|
4,063
|
2,344
|
2,344
|
|
Samsung KODEX MSCI Korea Total Return ETF
|
South Korea
|
278540 KS
|
1,446
|
769
|
861
|
|
Samsung KODEX 200 ETF
|
South Korea
|
069500 KS
|
6,431
|
1,101
|
727
|
|
NH QV KOSPI Volatility Matching Strangle ETN 57
|
South Korea
|
550057 KS
|
629
|
623
|
623
|
|
MIRAE ASSET TIGER MSCI Korea Total Return ETF
|
South Korea
|
310970 KS
|
560
|
557
|
517
|
|
ChinaAMC China 50 ETF
|
China
|
510050 CH
|
6,656
|
2,439
|
494
|
|
Mirae Asset TIGER 200 ETF
|
South Korea
|
102110 KS
|
3,232
|
781
|
480
|
|
YUANTA/P-shares Taiwan Top 50 1X Bear ETF
|
Taiwan
|
00632R TT
|
2,421
|
29
|
449
|
|
Cathay Bloomberg Barclays US Corp A- and Above 10+ Years Liquid ETF
|
Taiwan
|
00761B TT
|
455
|
398
|
398
|
|
Yuanta US 20+ Year AAA-A Corporate Bond ETF
|
Taiwan
|
00751B TT
|
623
|
616
|
350
|
|
E Fund ChiNext Price Index ETF
|
China
|
159915 CH
|
2,679
|
2,754
|
292
|
|
Xtrackers MSCI China Index UCITS ETF (DR) – 1C
|
Singapore
|
LG9 SP
|
6
|
618
|
291
|
|
Hang Seng H-Share Index ETF
|
Hong Kong
|
2828 HK
|
4,050
|
(719)
|
285
|
|
ChinaAMC CSI 300 Index ETF
|
China
|
510330 CH
|
3,316
|
1,694
|
260
|
|
Huatai-Pinebridge CSI 300 ETF
|
China
|
510300 CH
|
4,841
|
2,976
|
244
|
|
CSOP FTSE China A50 ETF
|
Hong Kong
|
82822 HK
|
2,282
|
(32)
|
238
|
|
ChinaAMC CSI 300 Index ETF
|
Hong Kong
|
83188 HK
|
1,711
|
548
|
204
|
|
Yuanta S&P GSCI Crude Oil 2X Leveraged ER Futures ETF
|
Taiwan
|
00672L TT
|
270
|
218
|
200
|
|
FUH Hwa China 5 + YR Policy Bank Bond Etf
|
Taiwan
|
00747B TT
|
557
|
536
|
177
|
|
Samsung KODEX Leverage ETF
|
South Korea
|
122630 KS
|
2,239
|
1,444
|
175
|
Investors tended to invest in core fixed income and equity, emerging markets, market cap and lower cost ETFs in December.
[ad_2]
Source link

