")
ronniechua/iStock via Getty Images
If we pull up a long-term chart of SPDR S&P Oil & Gas Exploration & Production ETF (XOP), we can see that shares look to have broken through their down-cycle trend line. Given that shares of the ETF are currently trading around the $120 mark, we would like to see more space between the prevailing share price and that multi-year trending line. The reason being is that once shares arrive at $125, for example, it would place the odds in favor (due to newly formed resistance) of a sustained move to the upside in this fund. The odds though (considering what I will discuss in this article) is that a fresh bull run is already underway in XOP.
Breakout potential in XOP (StockCharts)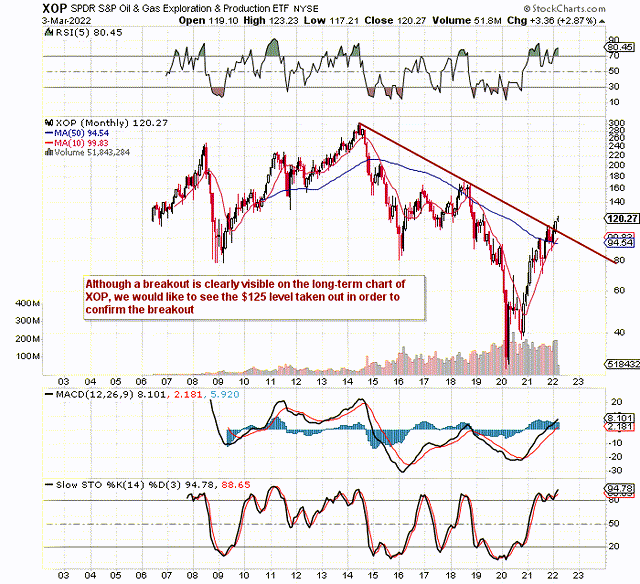
Moreover, as we can see from the daily chart, XOP is now trading well north of all of its main moving averages, and buying volume has increased significantly of late in the fund. This trend is confirmed when we go to the fund’s AUM numbers which have seen a colossal 32% growth rate over the past 30 days alone. We only really see the scope of XOP’s asset growth when we see that the asset class average, for example, actually experienced outflows (3%) during this timeframe.
Buying volume to the fore in XOP (StockCharts)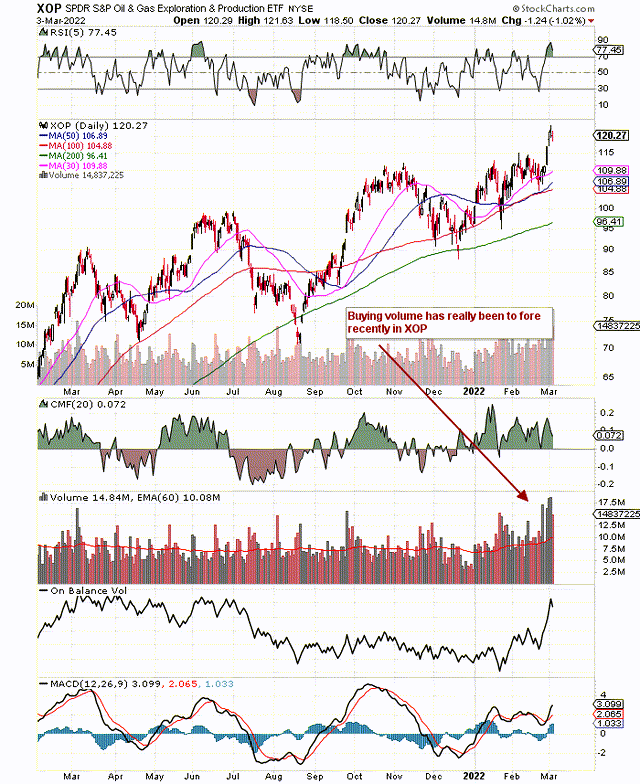
This searing asset growth resulted in an 8% move in XOP over the past month while the average move in this space among other funds was negative 2%. These pillars (Momentum & AUM growth) are essential when trading in ETFs for the long term which is why funds such as XOP are getting a lot of attention right now. However, another pillar that has proven to be essential for long-term success is volatility, and here is where XOP (at present at least) may be found wanting. This is true in equity investing also in that stocks with strong momentum, growing income (which is tied to AUM growth in ETFs), and low volatility normally outperform their high volatility counterparts for example.
However, we do not believe the spike in XOP’s implied volatility will result in a lower move in the near term here. The reason being is that option open interest continues to expand and now surpasses 800 thousand contracts. Rising open interest in an uptrend in the underlying is a bullish move. This basically means that fresh capital continues to enter this ETF, and when one combines this “interest” with the huge surge in buying volume of late, this leads us to believe that downside momentum is limited in this fund at this point.
Open Interest In XOP (Interactive Brokers)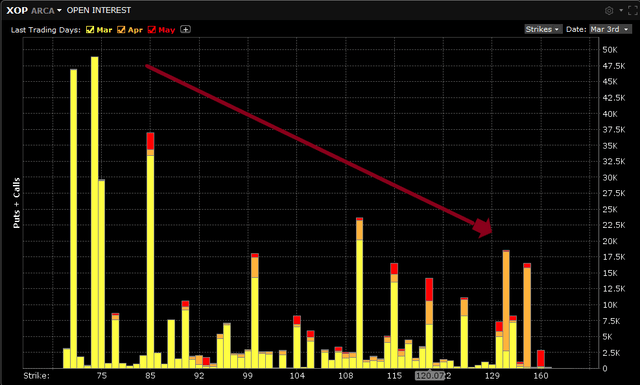
Suffice it to say, increasing volume and open interest usually lead to a continuation of the trend in action. Furthermore, if we study sentiment by looking at the relationship between the fund’s puts and calls, we can see that more “interest” continues to reside in the ETF’s put options. At present, the put/call ratio comes in at approximately 2.6 whereas the 52-week average comes in at 1.4. So sentiment is actually bearish at present (due to more puts being bought over call options). Bull markets rarely end with such negative sentiment which is why we use the put/call ratio as a contrary indicator. Whereas a very low ratio would point to an overbought market, XOP’s current 2.6 reading means there could be significant upside in this move yet.
Therefore, what we would be recommending would be to take advantage of the fund’s elevated volatility at present by putting on a directional position (using options) to the upside. As we see above in the technical chart, the 200-day moving average has provided solid support for the fund over the past 12 months or so. The regular June puts at the $100 strike are trading for roughly $480 per contract. Selling this strike gives the trader roughly an 81% probability of profit on the trade and a cost basis just above $95 a share. Furthermore, going out 105 days means one can take advantage of that high volatility on offer in that the put option will lose (all things remaining equal) roughly $18 in value for every 1% drop in implied volatility.
Therefore, to sum up, although volatility has spiked in XOP (which brings risk to the table), the fund’s technicals, as well as volume and open interest all illustrate to us that this fund is going higher. Therefore, risk-averse investors can actually use the elevated volatility on offer (as opposed to running from it) to significantly reduce cost basis down to a level where strong support is found. We look forward to continued coverage.