[ad_1]
syahrir maulana
(This article was co-produced with Hoya Capital Real Estate)
Introduction
You know there are lots of ETFs out there when one manager has multiple ones in the same asset class investing off different indices. In this article, I will compare two Vanguard Small-Cap ETFs that meet that criteria:
- The Vanguard Small Cap ETF (NYSEARCA:VB) invests based on the CRSP US Small Cap Index.
- The Vanguard S&P Small-Cap 600 ETF (NYSEARCA:VIOO) invests based on the S&P SmallCap 600 Index.
There is not a clear-cut winner based on return and risk data so understanding both will give investors data to help decide which is better positioned going forward. Before that, let’s take a longer look at history.
PortfolioVisualizer.com
Over the last decade, probably few investors surprise, Large-Cap stocks were the place to be, with Small-Cap coming in third. Going back to 1972, Mid-Cap comes out on top, Small-Cap second, and Large-Cap, last. Over the longer period, StdDev is inversely related to market-size. Believers in mean reversion would read this as time to increase their allocation to Small-Cap stocks.
Vanguard Small-Cap ETF review
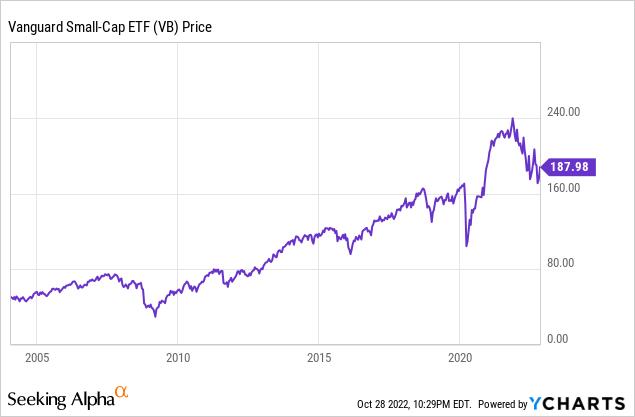
Seeking Alpha describes this ETF as:
The investment seeks to track the performance of the CRSP US Small Cap Index that measures the investment return of small-capitalization stocks. The advisor attempts to replicate the target index by investing all, or substantially all, of its assets in the stocks that make up the index, holding each stock in approximately the same proportion as its weighting in the index. The fund invests in growth and value stocks of small-cap companies. VB started in 2004.
Source: seekingalpha.com VB
VB has $104b in assets, with Vanguard charging only 5bps in fees. The current yield is 1.6%.
Holdings review
advisors.vanguard.com; compiled by Author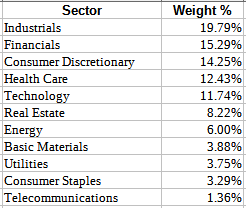
Unlike many Large-Cap ETFs, Technology stocks do not dominate VB’s holdings, placing 5th in sector weights. Vanguard divides the holdings unto over 140 industry classes; these are the ones with weights over 1.5% of the portfolio.
advisors.vanguard.com; compiled by Author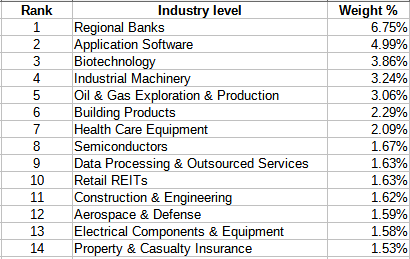
Top holdings
advisors.vanguard.com; compiled by Author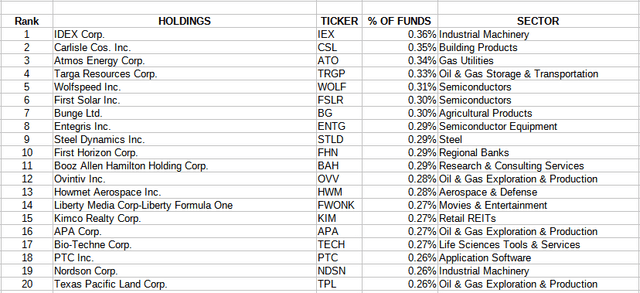
The Top 20 holdings, out of 1500, come to about 6% of the portfolio weight. Unlike some Large-Cap ETFs, no stock/stocks dominate the portfolio.
Distribution review
seekingalpha.com VB DVDs
In mid-2015, the ETF switched from semi-annual payouts to quarterly payouts. Along with its low yield, the growth has been only due to the growth in the year-end payments; the other payments have been in the $.5-$.55 range since post-COVID. Overall, the Seeking Alpha grading system gives VB a “A-” rating.
seekingalpha.com VB scorecard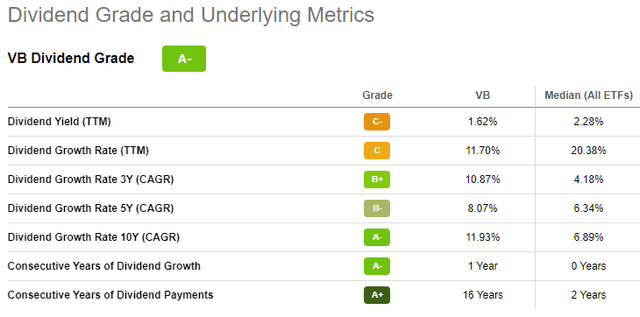
Vanguard S&P Small-Cap 600 ETF review
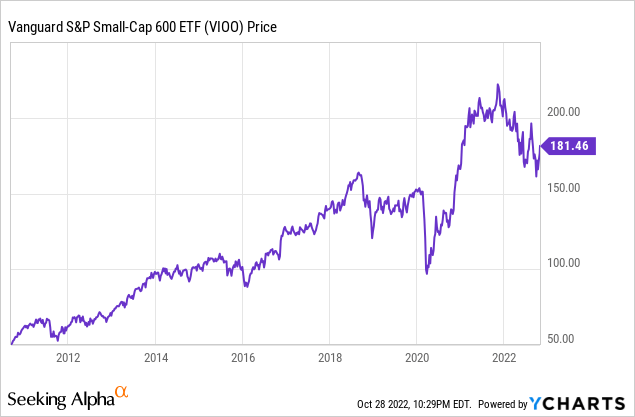
Seeking Alpha describes this ETF as:
The investment seeks to track the performance of the S&P SmallCap 600® Index that measures the investment return of small-capitalization stocks in the United States. The fund invests in growth and value stocks of small-cap companies. The Advisor attempts to replicate the target index by investing all, or substantially all, of its assets in the stocks that make up the index, holding each stock in approximately the same proportion as its weighting in the index. VIOO started in 2010.
Source: seekingalpha.com VIOO
VIOO has $3.7b in assets, a fraction of what VB holds: charging 10bps in fees (versus 5bps for VB) doesn’t help. The yield is slightly less also: 1.4%.
Holdings review
advisors.vanguard.com; compiled by Author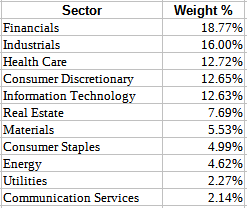
As with VB, Technology comes in 5th in sector allocations. Sector comparisons will be done later. This is a list of the industries with 1.5+% weighting.
advisors.vanguard.com; compiled by Author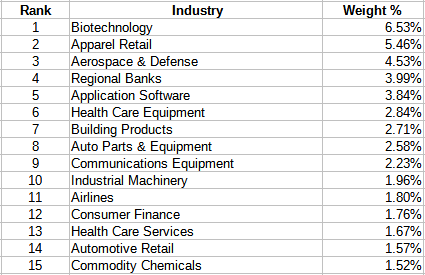
Top holdings
advisors.vanguard.com; compiled by Author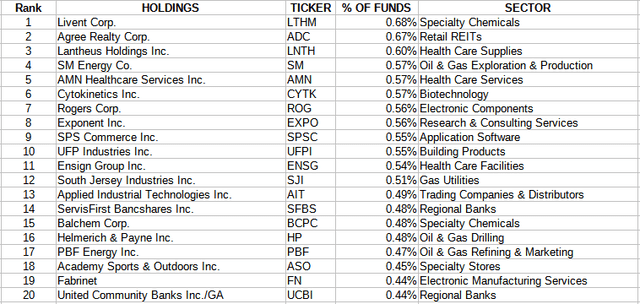
With only 600 holdings, the Top 20 here account for almost 11% of the portfolio; about twice the top weight in VB.
Distribution review
seekingalpha.com VIOO DVDs
I cannot remember when I have found a standard equity ETF that only paid dividends at year-end. This could be another reason the AUM is much smaller than VB’s. Their dividend grade is a notch lower than VB’s, a “B+” rating.
seekingalpha.com VIOO scorecard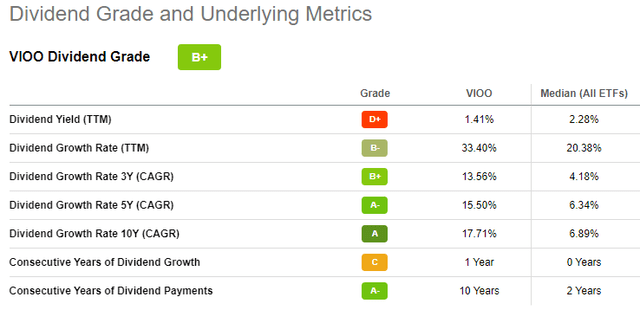
Comparing ETFs
Here is a side-by-side comparison of major ETF factors: there are some important differences!
advisors.vanguard.com; compiled by Author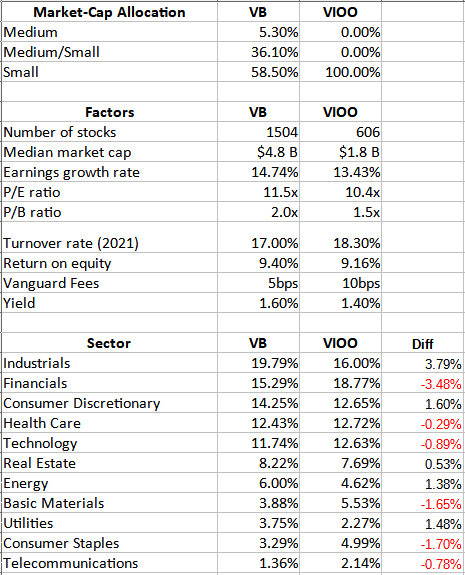
- The most important difference is market-cap allocations. VB drifts into stocks above the pure small-cap as defined by Vanguard. This results in the median market-cap for VB being $3b higher than VIOO shows.
- The biggest sector differences are in the two biggest sectors, which flip in their ranking within each ETF.
- As pointed out earlier, VB owns 2.5X the number of stocks that VIOO holds.
- Also mentioned before VIOO comes with 5bps more in fees for no logical reason.
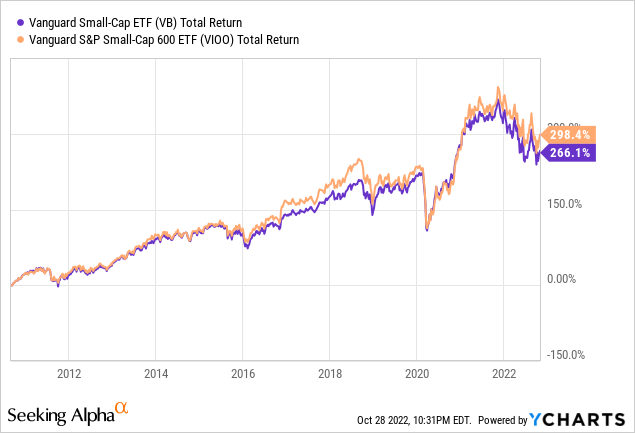
Since its inception in 2010, VIOO has provided an annualized 70+bps higher return than VB, though with a slightly higher StdDev. Both the Sharpe and Sortino ratios still favor VIOO over VB.
Portfolio strategy
Above I presented data that shows Small-Cap stocks have done okay when compared to their larger cousins. Where Small-Cap stocks seem to be market leaders is after meltdowns have occurred. Since 1972, these are the calendar years Small-Cap stocks were the best performers.
PortfolioVisualizer.com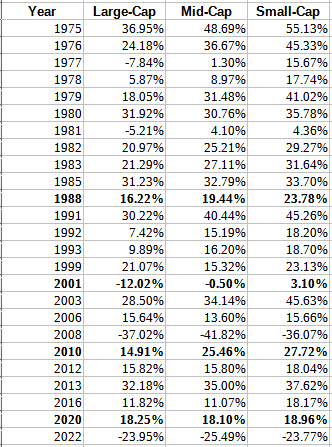
Besides the rebound years I bolded based on my memory, note the long stretch at the top; years of high inflation like we are currently experiencing. To back up my casual observation, I looked for some expert views.
Looking at post-recessions data from 1980-2009, it shows Small-Cap stocks starting to outperform 12-months before, peaking 36-months after the recession ended. That bodes well the US GNP entered recession by mid-2022.
putnam.com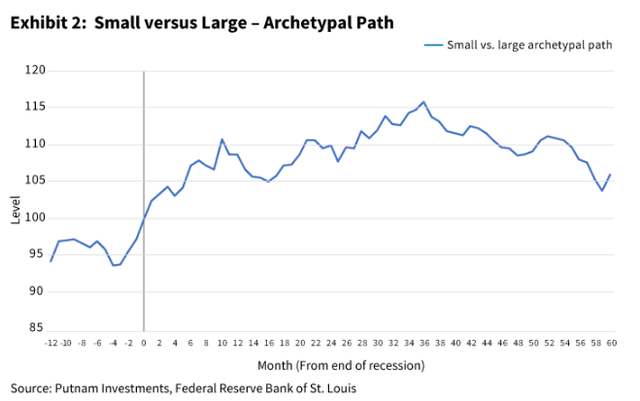
Using even more data, the next table compares Large-, Mid-, and Small-Cap returns during four distinct parts during recessions back to 1954. Here, Small-Cap returns shown best during the 2nd half of the recession and in the post-recession year; not so much in the first two segments. This seems to be at odds with the above chart though but could mean history is changing.
anchorcapital.com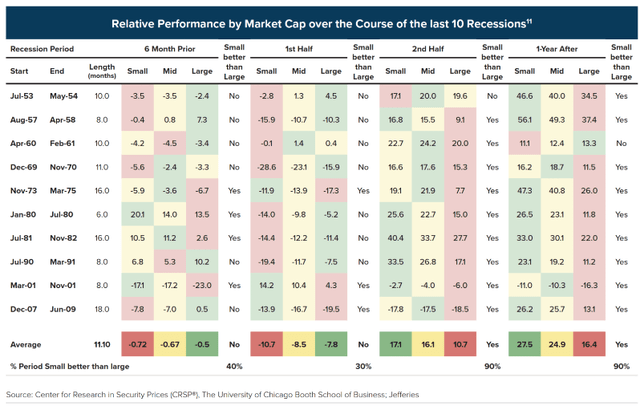
Two other articles I located were:
- Considering small caps in an economic slowdown
- When Recessions End, Small Caps Have Led the Way
Final thought
For investors looking wanting a Vanguard Small-Cap ETF, VIOO is the better choice based on its market-cap allocation and CAGR. For those who prefer other managers, here is four other ETFs, plus the two covered here.
Hoya Capital Income Builder
The iShares Core S&P Small-Cap ETF (IJR) follows the same index as VIOO for those who prefer iShares ETFs.
[ad_2]
Source links Google News

