")
[ad_1]
Diego Thomazini/iStock via Getty Images
I don’t often dip my toe in the waters of trying to forecast “the market”, because I come from the school of “it’s a market of stocks, and not a ‘stock market’.” “Don’t often” is not the same thing as “never”, though, so I thought I’d share with you my thoughts about the relative merits of stocks versus other asset classes. I’m of the view that in the domain of investing, everything is relative, so when we buy “X”, we are, by definition, eschewing countless “Ys,”, other “Xs” and every other letter you can name. Today I want to compare an investment in the SPDR S&P 500 Trust ETF (NYSEARCA:SPY) with an investment in the 10-year United States Treasury note. Given the alternatives, I want to work out whether the recent price weakness in SPY represents a buying opportunity or not.
I should state up front that part of the reason I write for this site is to gain access to the wisdom of the crowd. In articles on individual stocks, I often joke about what a braggart I am, but the fact is that I’ve been humbled by markets many times over the years. This is one reason why I find them so fascinating. Anyway, I like to access your collective wisdom in the hope that if I present an idea that’s silly, and you people can point out where my thinking is wrong, and that can save me money, I welcome your feedback. With that preamble out of the way, let’s get into it.
When trying to answer the question of “SPY or 10 year treasuries”, I think a good first step would be to review a bit of history. Specifically, I think it would be helpful to review how the SPY ETF performed in both rising and falling yield environments over the past decade.
History As Guide
I’ve reproduced a short history of the yield on 10 year treasury notes since the GFC, and I introduce it here for your enjoyment and edification. Please note that there are 8 periods I want to write about, marked on the graphic. Four of these periods saw falling yields, four of them saw rising yields, per the following.
10 Year treasury yields since the GFC (Marketwatch)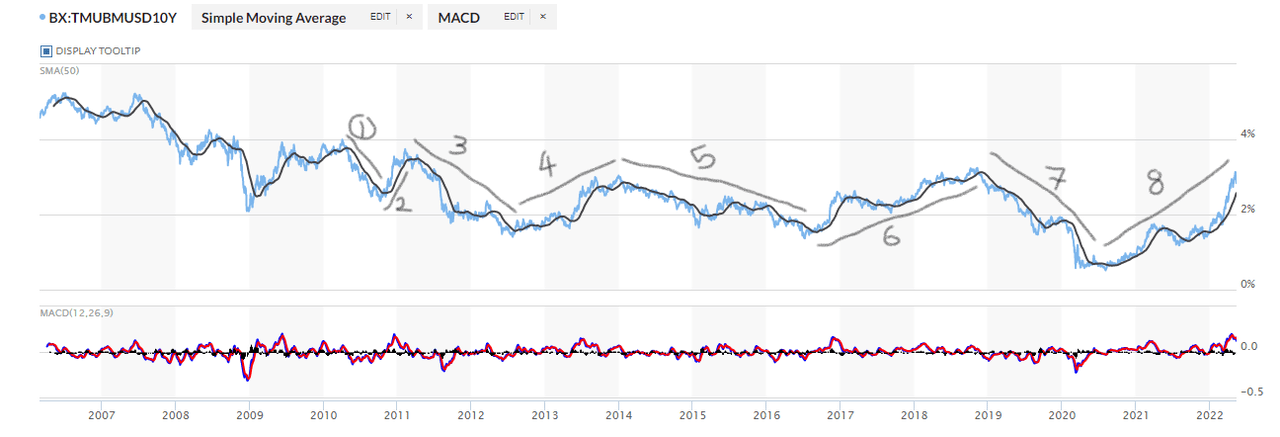
So, in periods 1, 3, 5, and 7, we saw falling yields, and rising treasury prices. We saw the reverse in periods 2,4,6, and 8. There’s obviously some variation in yields over time, and I could have performed a much more fine tuned analysis. In my view, a more fine tuned analysis won’t add much to the robustness of the argument. I want to look at the broad sweep of yield history to try to mine some information that may be useful. Specifically, how have stocks behaved when yields were generally rising or generally falling?
“But wait”, I imagine you are asking. “How are we expected to remember how stocks behaved during these 8 yield regimes?” I’m glad you asked me that, my rhetorically convenient friend. Once again, I’m here to demonstrate that I will go to the ends of the Earth to try to improve your reading experience. In the table below, I’ve chronicled the approximate price at which the SPY started each of these periods, and the approximate price at which it ended each of these periods. Anyway, feast your eyes on this little gem.
SPY Performance in Rising and Falling Yield Environments (Author calculation from public sources)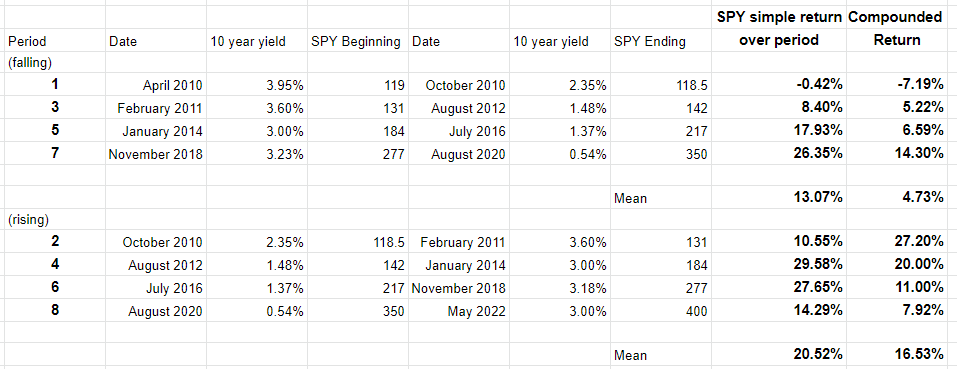
There are a few things to note about this chart. First, I’ve calculated both simple and compounded returns. I need to add the compound returns so we can compare like with like. For example, period 1 is only 7 months long, while period 5 is 31 months long, so it would be silly to not annualize these returns. That’s what I’ve done in the “compounded return” column.
I feel like making a few observations about our recent history, so I’m going to make a few observations about our recent history. Here they are in no particular order.
-
On average, the SPY saw greater returns during the four periods of rising rates, relative to periods of falling rates.
-
Not only did stocks seem to outperform during periods of generally rising rates, but the volatility of those returns seemed to be much lower. I haven’t calculated variance on these series, but a visual review shows that over these eight periods, the market was generally much “calmer” when rates were rising. Please see my appendix notes for short, and uncharacteristically brief descriptions of each of these periods.
-
It’s been 11 years since we’ve seen yields on the 10 year note hit 3.6%. In 2011, global debt was about $202 trillion. Today global debt clocks in at just shy of $300 trillion. This is relevant in my view, because the mountain of debt under which we currently toil presents policy makers with a very significant upper limit on short term rates. Beyond the short term, it’s the market (and not the Fed) that sets rates, and it too is constrained by our debt burden.
My (Tentative) Perspective: Bonds Have More Fun… Sometimes
I suspect SPY did generally better in periods of rising rates because at the beginning of the period in question, (i.e. when yields were on the low side), the opportunity cost of owning stocks was quite low. Stocks are relatively more attractive at those times when yields are low, and so they attract more capital. If you’ll forgive my tedious tendency to belabour a point with a hypothetical, imagine that you’re managing a pension fund and it’s August of 2021. Would you put your pensioner’s assets in treasuries that are yielding less than 1.17%? Perhaps you would not be inclined to take that trade. Conversely, let’s pretend that it’s November of 2018 and you are presented with the opportunity to lock in a yield of 3.23% on your pensioner’s capital. Would you take it? If you did so, you would have missed the ~17% market drawdown in late 2018, and would have seen your capital rise nicely into August of 2020. More importantly, though, that 3.23% might be an acceptable yield. When a certain threshold is crossed (perhaps from 2.5% to 3%), you may eschew stocks for a variety of reasons. Finally, I’m starting to think the terrible returns we’ve seen so far this year may in part be driven by another regime change like the 7 above.
Cash Flow Comparison
I’m going to switch gears now, and start to think less about past price changes, and more about the cash flows associated with the possibilities before us. I forget where I read it, but someone far smarter than me once quipped that speculators buy assets for their price appreciation, and investors buy assets for their cash flows. The cash flows provided by various assets are of critical importance for a number of reasons in my view. Cash flows are important because they support the price of a given asset. If an organisation provides owners with a predictable, sustainable cash flow, there is a price below which that asset will not fall. Additionally, cash flows are important because they provide investors with an income stream that they can use to buy Creedence tapes, rugs that really tie the room together or bowling balls to pick three examples. Finally, capital gains are nice, but what the market giveth, the market can taketh away. If I make a capital gain on a stock, it can (and often has) been taken from me in a correction. If I earn an income, I can spend the small portion that I don’t have to hand to my government, currently run by this guy.
Given that I consider cash flows from various investments to be of critical importance, and given that I’m of the view that investing is a relativistic process, I think it would be worthwhile to actually calculate the amounts of cash that we’d receive from various sources over the next decade. Specifically, I’m going to compare the cash flows received from a 10 year treasury note on the one hand, and an identical investment in the SPY ETF on the other. Obviously the cash flows from the former are far more certain than the latter, and that impacts my relative preference for each.
Rules of the Road
Here are the facts and assumptions informing my analysis.
-
I’m assuming that the choice investors must make is between a $20,000 investment in the SPY ETF or a $20,000 treasury note.
-
As I type this, the yield on the 10 year treasury is 2.915%
-
Additionally, the current yield on the SPY ETF is 1.48%
-
Between 2017 and 2021, the dividend on the SPY ETF grew at a CAGR of 3.55%. It may be aggressive, but I’m going to build a scenario where the dividend grows at this rate over the coming decade.
-
I’m also going to run a zero dividend growth scenario.
I don’t perform analyses like these to try to forecast a “to the penny” comparison between these two alternatives. I want to get a sense for the cash flow “margin of safety” for one asset class over another. In other words, the greater the delta between the cash flows received from the SPY ETF and the treasury, the less attractive the former, and vice versa. Additionally, the inherent unpredictability of stocks means that I’m going to need a wider margin of safety from them relative to treasuries.
Results
-
Assuming zero growth in the SPY dividend, the treasury investor will receive ~$2,870 more in cash flows than the SPY holder over the next 10 years. This delta represents about 14.4% of the original investment. Put another way, in order to be indifferent between the two assets in a zero growth environment, the SPY investor will need to achieve a 14.4% capital gain over the next decade.
-
Assuming the SPY dividend grows at a CAGR of 3.55%, the treasury investor receives “only” $2,344 than the SPY investor. This represents just under 12% of the original capital. If the dividend grows at 3.55% over the next 10 years, the SPY owner needs to earn an additional 11.7% capital gain to be indifferent between these two assets.
I’m not going to offer an opinion about the likelihood of capital gains between 11.7%-14.4% for the SPY ETF. Far smarter people than I have trod over that ground already and have come to some different conclusions.
For my part, I really like my beauty sleep. I really need it and I clearly don’t get enough. A necessary precondition for a good sleep in my experience is having a more predictable future. When I was a stockbroker, I found that the majority of my clients felt the same way. We like predictability. This is why I’m tilting away from equities and buying treasuries at the moment. The (larger) cash flows are known in advance. Also, if rates start to fall again, there is enormous potential for capital gains. Also, since the risk free rate has risen dramatically recently, the amount by which we must discount the future cash flows from accounting earnings has also risen. This obviously reduces the net present value of these cash flows, and the various projects that companies invest in. This negatively impacts stock values. Finally, for all of their faults, you also know that Uncle Sam will repay you 100 cents on the dollar when the bond comes due. The same cannot be said for the SPY ETF.
Cash Flows of 10 year treasury v SPY ETF (Author calculations from public sources)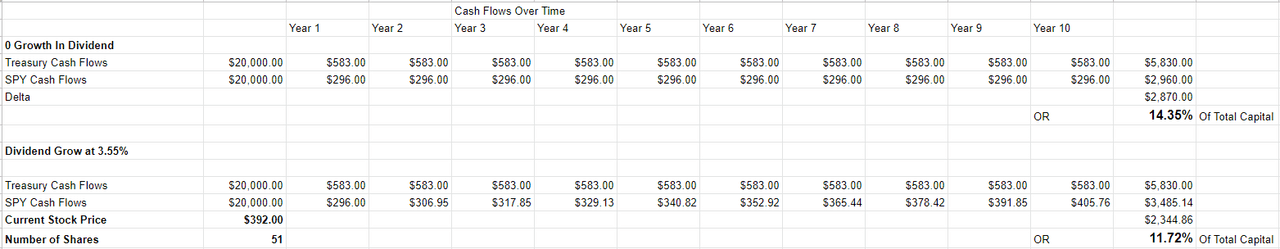
Pre-Empting Criticism
It may come as a shock to you, but I’m disagreeable enough to make arguments like the above to dyed in the wool stock investors that I know in so-called “real life.”. I’ve heard their criticisms, and I’ll offer my reply to the most common of these here. This may save you the time you would have taken writing me a friendly and well reasoned comment. Far more importantly, it may save me time because I won’t be obliged to offer near identical responses to near identical criticisms.
-
Bonds are subject to inflation. That is true. Do you know what else is subject to inflation? Dividends are subject to inflation. The lump sum you get when you finally sell SPY is also subject to inflation. Unlike these treasuries, that lump sum may not be 100 cents on the dollar.
-
Your analysis does not take taxes into account. That is true. I don’t consider tax here because each individual’s tax situation is unique. Before taking this (or any) advice, I would strongly recommend talking to a tax professional. Alternatively, if you’re Canadian you can employ this strategy in your RRSP or TFSA. If you’re American, you can use this approach in your (very strangely named) IRA account.
-
If your “bonds have more fun” strategy is so great right now, why do so many people still suggest stocks for the long run? When I was in the business, my fees and commissions on equities were massively higher than the commissions I made on bonds. I’m not sure why more professionals aren’t recommending this approach, but I’m sure the relative fee structure has nothing to do with it.
Conclusion
In my view, SPY is a terrible investment at the moment. In the world of investing, everything’s relative, and SPY seems a relatively poor choice at the moment. The cash flows an investor receives for the investment is far lower than they would earn on the risk free investment. Additionally, the rising risk free rate decreases the present value of future cash flows, and this impacts stock valuations. Finally, there’s a reasonable argument to be made that yields are about to fall, and recent history suggests that stocks do less well in that sort of environment. While I’m going to continue to sell deep in the money puts opportunistically, I’m tilting 60% of my portfolio toward treasuries at the moment. These offer the predictability that I think all investors crave, and they offer the best potential for capital gains in my view. I look forward to reading your well reasoned, calm, and respectful thoughts about my approach below.
Appendix
|
Period |
Notes |
|
1 |
Falling Yields. Market drops about 15% between April 2010 and July 2010, then recovers, ending the period basically flat. |
|
2 |
Rising Yields. Very smooth ride. Upward sloping. Not much chop. |
|
3 |
Falling Yields. Feb 2011 to Sept 2011 market down about 13% to 113. Then has choppy ride to 142 characterised by some significant volatility |
|
4 |
Rising Yields. Very smooth ride. Upward sloping. Not much chop. |
|
5 |
Falling Yields. Most gains had by May of 2015 (at 212 in May 2015), then very volatile moves takes us to 217 after 14 months of chop. |
|
6 |
Rising Yields. Very smooth ride from January 2016 to late January 2018. Drops dramatically into March of 2018. Smooth climb to September 2018 where drops in final quarter of 2018. |
|
7 |
Falling Yields. Most returns happen in a long smooth ride to crash of early 2020. Sharp drop followed by sharp rally. |
|
8 |
Rising Yields. Very smooth ride from August 2020 to December 2021. Correction town since then. |
[ad_2]
Source links Google News