
[ad_1]
Andrii Yalanskyi/iStock via Getty Images
This article was first released to Systematic Income subscribers and free trials on May 10.
Rising interest rates have been hard to miss for income investors. 10Y Treasury yields have almost doubled since the start of the year and risen above 3% – a development that has also hammered many income assets.
In this article, we discuss why some of the shorter-duration bond funds now look attractive. In short, funds like the SPDR Barclays Capital Short Term High Yield Bond ETF (NYSEARCA:SJNK) now offer an unusual combination of higher yields and shorter duration than some of their longer-term counterparts.
We also highlight why a fund like SJNK actually offers investors an underlying yield of around 7.3% rather than the 5% or so that they see in their distributions.
For investors looking to dial down their interest rate exposure while generating a yield north of 7% without having to wear the volatility of leveraged CEFs, SJNK looks like an attractive option.
Have Your Cake And Eat It
Historically, fixed-income investors have had to make a choice – move out the yield curve to increase duration exposure and earn a higher yield or decrease duration exposure by moving down the yield curve but earn a lower yield. This trade-off in duration exposure vs yield is a direct result of the fact that the yield curve is generally upward sloping so that longer-term bonds carry a higher yield than shorter-term bonds. Typically, investors who want to generate a higher yield without taking on more credit risk need to take more duration risk.
This relationship has recently broken down. Investors can now generate the same or higher yield by taking less duration exposure. Let’s see what this looks like in Treasury bonds. We can use many different pairs of tenors but let’s use the 3Y/5Y yield curve which is shown in the chart below since 2000 with the red line marking the latest differential between the 5Y Treasury bond yield and the 3Y Treasury bond yield. As of this writing the 5Y Treasury bond yield does offer a small yield pickup of around 0.12%. This is not far from a historically low level. And it also comes with the cost of nearly twice the duration exposure. The takeaway here is that nearly doubling duration exposure via 5Y bonds versus 3Y bonds offers essentially no compensation for investors.
Systematic Income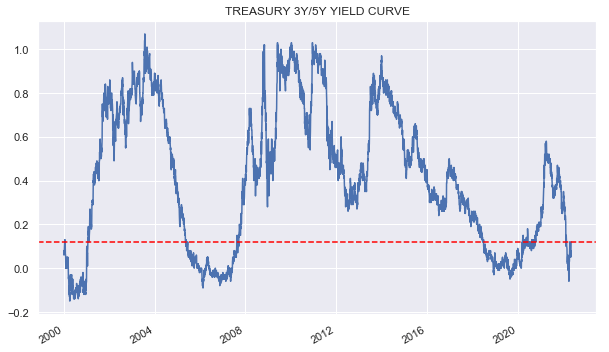
In this article, we talk about SJNK, which holds high-yield corporate bonds rather than Treasuries. So, to get a clearer yield picture, we also need to look at corporate bond credit spreads, which are the additional yield compensation above Treasuries that corporate bonds pay to investors in exchange for taking on corporate credit risk.
In a normal market environment, credit spreads are upward sloping as well. In other words, a 5Y high-yield corporate bond typically offers a higher yield premium above the 5Y Treasury bond than a similar 3Y high-yield bond offers above the 3Y Treasury bond.
Much like the normally upward sloping Treasury yield curve this is pretty intuitive. Taking 5Y corporate credit risk should compensate investors more than taking 3Y corporate credit risk. However, this “credit spread curve” tends to flatten out when corporate credit spreads near a level of around 5%. The reason for this is that when credit spreads rise meaningfully, investors start worrying about near-term risk as much as longer-term risk. Credit spreads are currently approaching the level of 5% and this has also flattened the credit spread curve meaning. Short-maturity corporate bonds have a similar credit spread as longer-maturity bonds, all else equal.
The upshot here is that the corporate bond market occasionally sees a situation where shorter-maturity bonds offer the same or higher yield as similar longer-maturity bonds. This is the case now.
Let’s take a look at two screenshots below. This one shows the yield profile of SJNK – a high-yield corporate bond ETF with a duration profile of 2.44.
SSGA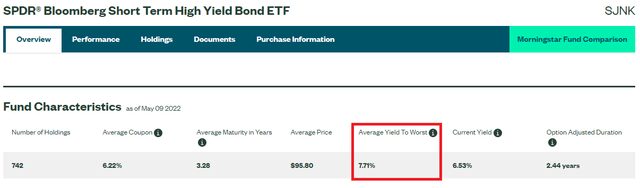
And this screenshot show the yield profile of the benchmark SPDR Bloomberg High Yield Bond ETF (JNK), with a duration of 4.27.
SSGA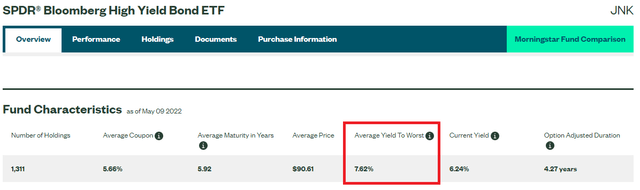
The yields highlighted in both screenshots are the yields that matter to investors. These are the yields that investor capital actually accrues in these funds. We can see that SJNK has a 0.09% higher weighted-average yield-to-worst than JNK. The credit rating profiles of the two funds are similar.
This is the direct outcome of the two dynamics discussed above – a flat Treasury yield curve and a flat corporate credit spread curve. This allows investors to earn a pretty similar yield while shortening up on their duration exposure. SJNK allows investors to cut their duration exposure relative to JNK by 43% while generating a slightly higher yield in the process.
At this point investors may have two concerns. First, what about the longer-term performance profile? Are investors leaving money on the table by shortening up duration? The answer is – probably not. The chart below plots longer-term performance profile of the two funds. And while JNK does tend to run up ahead of SJNK it just as often comes right back to the same point, in effect, ending up in the same place but with much higher volatility.
Systematic Income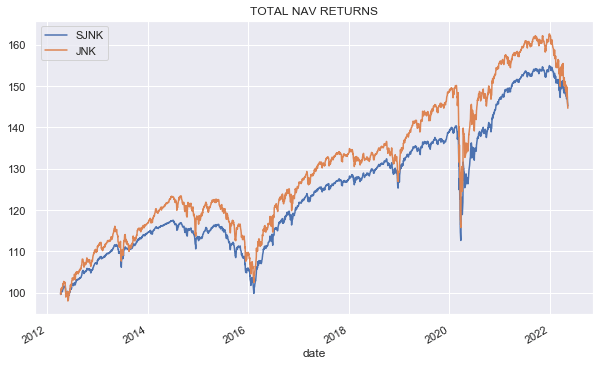
And the second point – what is this about a 7.71% yield when SJNK has a 5.09% distribution rate? The key point here is that while SJNK distributes a yield of 5.09%, its underlying bond portfolio accrues yield at a 7.71% level. It’s not clear why SJNK is so miserly with its distribution, but it likely has to do with the fact that the fund’s yield-to-worst is more volatile than its current yield and it’s the current yield that tends to drive the distribution rate. The yield-to-worst has spiked up recently more than the current yield because it takes into account the portfolio pull-to-par, which is the additional tailwind investors get when the weighted-average price is below par as it is now at $95.80.
Of course there is also the matter of the fund’s 0.40% fee so the best yield estimate for investors net of the fee is 7.31% – a pretty attractive level for a low-duration fund with no discount volatility or leverage. The chart below shows how SJNK has compared to both JNK as well as the High-Yield Corporate Bond CEF Sector so far year-to-date. SJNK is down about 6%, while the HY CEF sector is down 17.5%. Investors who are concerned about either rising Treasury yields or a potential recession may find value in SJNK.
Systematic Income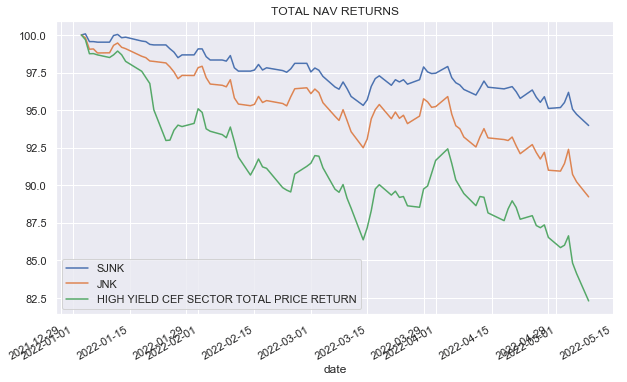
Takeaways
In the current market environment, investors who are looking to shorten up on their duration exposure while generating decent yields may want to have a look at shorter-duration corporate bond funds such as SJNK. A relatively flat Treasury yield curve combined with a flat corporate credit spread curve means shorter-maturity corporate bonds can now offer similar or even higher yields than their longer-maturity counterparts. This can allow income investors to have their cake and eat it too – by shortening up on duration without giving up any yield. The other attractive point about SJNK is its distribution rate is deceptively low – its actual weighted average portfolio yield-to-worst is a very respectable 7.71% or 7.31% after fees are taken into account.
[ad_2]
Source links Google News