")
[ad_1]
Richard Drury
I recently wrote a positive article on the Schwab U.S. Dividend Equity ETF (NYSEARCA:SCHD). One reader messaged me privately asking me to compare SCHD with one of his existing investments, the ProShares S&P 500 Dividend Aristocrats ETF (BATS:NOBL).
I think NOBL is a fine fund in its own right. It has strong compounded returns and invests in high-quality companies. However, when compared to SCHD, I find SCHD has better historical returns and risk metrics, not to mention a higher dividend yield and lower fees. For me, personally, I would rather own SCHD.
Fund Overview
The ProShares S&P 500 Dividend Aristocrats ETF is a fund designed to track the S&P 500 Dividend Aristocrats Index. It provides a low-cost method to invest in high-quality companies that have paid and grown dividends for at least 25 consecutive years. NOBL has $10 billion in AUM. Figure 1 shows some basic characteristics of the Fund.
Figure 1 – NOBL fund facts (proshares.com)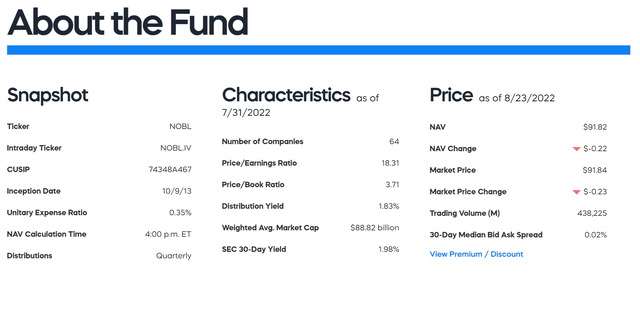
Strategy
The strategy behind the S&P 500 Dividend Aristocrats Index is to target companies currently in the S&P 500 Index that have increased dividend payments each year for at least 25 years. There are also market cap and liquidity constraints. The index contains a minimum of 25 stocks, equally weighted, and no sector is allowed to be more than 30% of the index. The index is rebalanced quarterly and reconstituted annually.
Fees
NOBL charges a 0.35% expense ratio. This is on the high side, as large-cap exchange-traded funds (“ETFs”) typically charge fees in the single basis point range. The SPDR S&P 500 Trust ETF (SPY), for example, charges 0.09%. Vanguard S&P 500 ETF (VOO) charges 0.03%.
Distribution and Yield
According to the fund’s literature (Figure 1 above), NOBL has a 1.98% SEC 30-Day yield. This is slightly higher than the S&P 500’s 1.7% dividend yield.
NOBL’s distribution is variable and paid quarterly. Its most recent distribution was $0.388262/share, paid on June 29, 2022. NOBL’s distribution has been on an upwards trend, compounding at a 5-yr CAGR of 13.7% (Figure 2). Note, the year-end payment tends to be larger than the quarterlies.
Figure 2 – NOBL Dividend History (Seeking Alpha)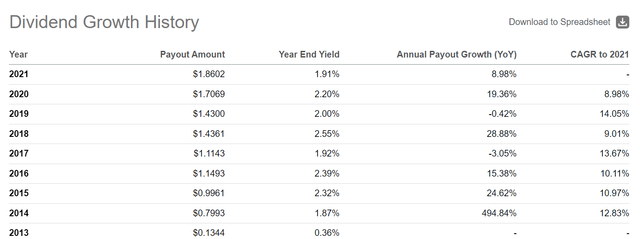
Portfolio Composition
Due to the index requirement for 25 years of continuous dividend growth, the S&P 500 Dividend Aristocrats index tends to skew defensive. As of June 30th, the index has a 22% weight in Consumer Staples, 18% weight in Industrials, and 13% weight in Materials (Figure 3). Information Technology only has a 5% weight. This is quite different from the S&P 500, where the weights for those four sectors are 7%, 8%, 3%, and 28% respectively.
Figure 3 – Dividend Aristocrat Index sector weights (proshares.com)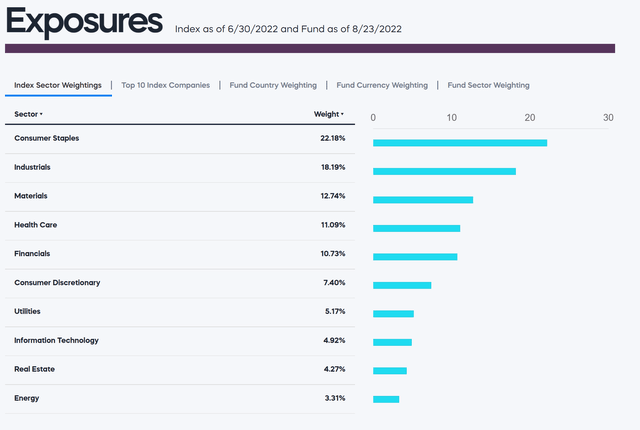
Furthermore, the Fund itself has slight differences in sector weights from the index it is tracking (Figure 4). Comparing figures 3 and 4, the notable differences between the index and the Fund are that the Fund has a higher weight in industrials (20.4% vs. 18.2%), a lower weight to Information Technology (3.3% vs. 4.9%), and a higher weight in Energy (4.8% vs. 3.3%).
Figure 4 – NOBL sector weights (proshares.com)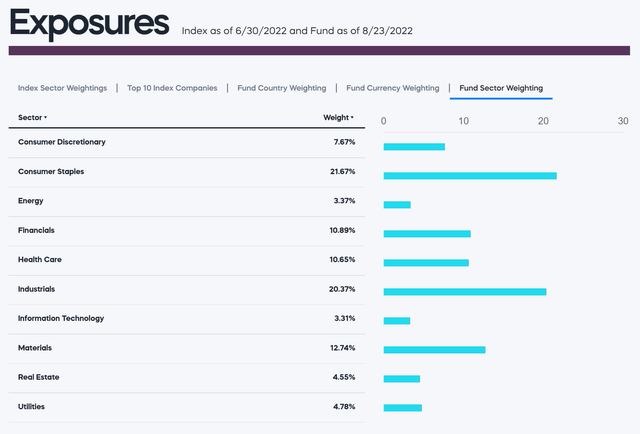
Overall, the fund has 64 positions with a weighted average market cap of $89 billion. The average P/E ratio is 18.3x.
Returns
NOBL’s returns have generally been pretty good, with 3 and 5-Year compounded returns of 11.5% and 11.7% respectively. Since inception, NOBL has compounded at 12.0% (Figure 5).
Note, the Fund has generally lagged the S&P 500 Dividend Aristocrats Index by 40-50 bps per annum. This can be explained by the Fund’s 0.35% expense ratio and tracking error.
Figure 5 – NOBL returns (proshares.com)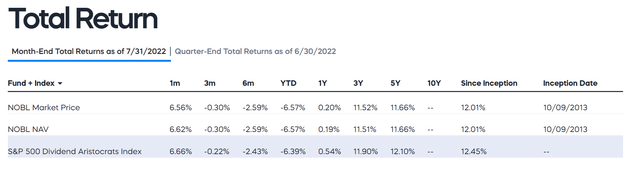
However, if we analyze NOBL using Morningstar’s lens, we see that the fund has only been a 2nd or 3rd quartile fund compared to the peer group (Figure 6).
Figure 6 – NOBL returns against peers (morningstar.com)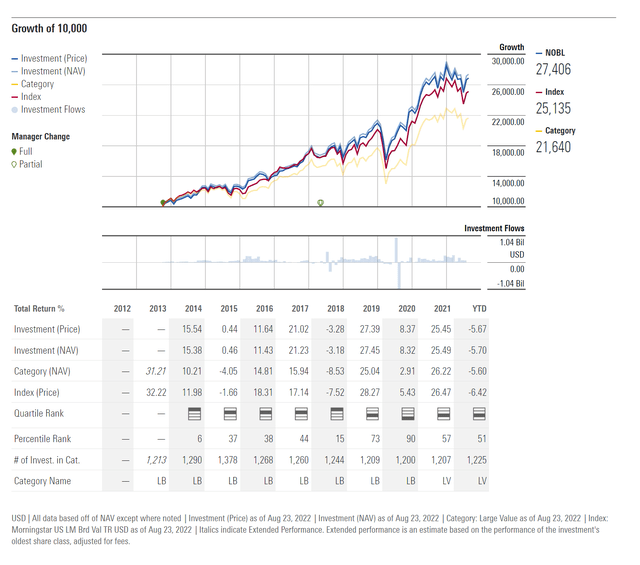
From a risk perspective, NOBL has delivered higher returns with lower volatility (3 and 5Yr) compared to the index and category (Figure 7). This is a plus and speaks to the selection criteria to the Dividends Aristocrats Index.
Figure 7 – NOBL Returns vs. Risk (morningstar.com)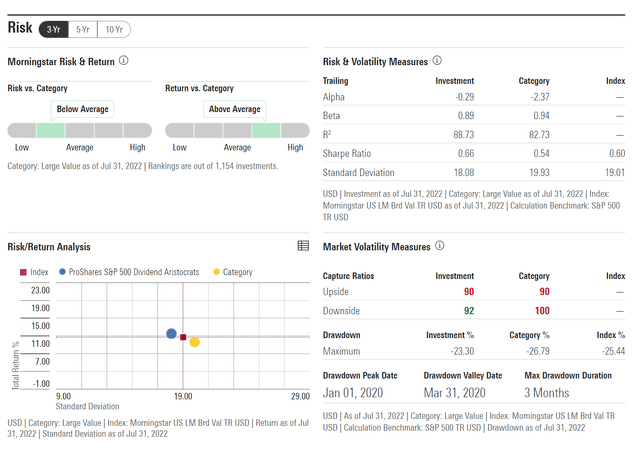
SCHD vs. NOBL
How do I compare the ProShares S&P 500 Dividend Aristocrats ETF versus the Schwab U.S. Dividend Equity ETF?
First, let’s compare the returns, as that’s top of mind for all investors. Using Portfolio Visualizer to compare the two investments, we can see that SCHD has a higher return CAGR of 12.0% vs. 10.9% for NOBL (Using a January 2014 start date to make returns comparable).
Figure 8 – SCHD vs. NOBL (Author created using Portfolio Visualizer Tool)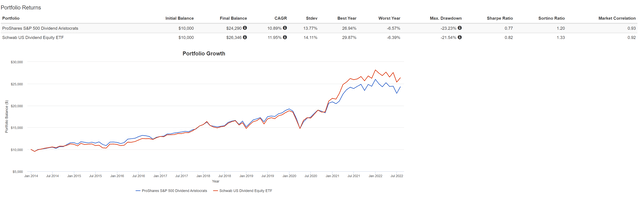
Next, SCHD also has slightly better risk metrics, with a maximum drawdown of 21.5% vs. 23.2% for NOBL. SCHD has a 0.82 Sharpe Ratio, vs. 0.77 for NOBL. Finally, SCHD has a 0.92 correlation to the market, while NOBL has a 0.93 correlation.
SCHD also has a higher distribution yield of 3.2% vs. NOBL’s 2.0%, for those that care about current income.
Finally, comparing the fees (returns are variable, fees are not), SCHD is much cheaper, with a 0.06% expense ratio vs. 0.35% for NOBL.
Risks
As a fellow SA contributor correctly noted in his recent article comparing dividend ETFs, many dividend ETFs have only gained popularity in the past decade and have not faced a serious market threat like the current inflationary environment. At the same time, I would argue that there are not many funds or investors alive who have invested in the 1970s (the last time we saw this level of inflation), so that is a moot point.
When I look at funds like SCHD and NOBL, I am comforted by the fact that they primarily invest in large cap stable businesses that have been able to fund dividend increases for many years (decades in the case of NOBL). In addition, SCHD further pre-screens the investments for cash flows to debt and returns on equity, which further narrows down the field. While nobody has a crystal ball on what the future holds, I think owning a basket of high-quality, dividend-paying equities for the long-term is a fairly safe bet.
Conclusion
In conclusion, NOBL is an easy approach to invest in high-quality, dividend-paying companies in the S&P 500. However, when compared to SCHD, I find SCHD has better historical returns and risk metrics, not to mention a higher dividend yield and lower fees. While NOBL is a decent fund in its own right, I would rather own SCHD in my long-term portfolio.
[ad_2]
Source links Google News