")
da-kuk
General Overview
For regular readers of my ETF posts, they are likely to notice a common theme. 2022 has been tough and there has been little way around it. If you have been managing capital, balancing asset allocation among market sectors was a juggling act and if you got it wrong, you were punished accordingly.
We had spent a good part of 2021 where risk capital could do no wrong. Characterized by egregious amounts of money flooding into SPACs, questionable business ideas (remember WeWork anyone?), a Federal Reserve trumpeting transitionary inflationary forces, the Wall Street Bets fan boys, and the evil shorts.
If 2021 was champagne and caviar, then 2022 really was meat and potatoes.
That is the very reason asset allocation with sector ETFs, such as (SPY), (IWM), (DIA) or even (NYSEARCA:IWF) is so critical. Because these ETF wrappers generally embrace a common bunch of themes geared to certain parts of the business cycle.
Big inflation? Look at currency, commodities and perhaps some financial sectors. Bullish consumer sentiment? Hide out in consumer discretionary and perchance (SPY)? Eyewatering energy prices? Why not consider (XLE)?
Which brings us to the start of today’s post – iShares Russell 1000 Growth ETF comprised of smaller, more volatile US stocks with big growth and domestic exposure. These often front run a generally bullish market but oppositely, they too also front run the downside when sentiment weakens, like it has during the year.
It is for that reason, I am not too excited not about iShares Russell 1000 Growth ETF or its more regularly traded cousin, the iShares Russell 2000 Growth ETF. Having said that, it makes for useful positioning when the time is right so let’s find out more.
Tradingview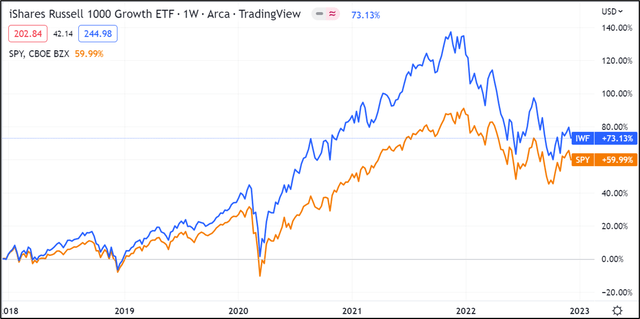
It is worth noting that in periods of general bullishness, IWF tends to lead the S&P 500 to the upside. The same is true to the downside.
ETF Overview
iShares Russell 1000 Growth provides investors the opportunity gain exposure to US companies whose growth is expected to grow at an above average rate relative to the overall market, hence its ability to lead broader indices.
It targets principally US domestic equities with a tilt towards the growthier side of the equity market. In summary, the fund tracks an index composed of 1000 large and mid -capitalization US stocks that exhibit growth traits (high P/E ratios, big revenue growth, little to no earnings, heavily exposed to increasing interest rate environments)
It has sizable holdings, with funds worth $61B making up the wrapper. Volumes and liquidity are the same, with the iShares stalwart finding a place among the bigger, more prominent exchange traded funds.
Despite the fund tracking an index of 1000 mid to large cap securities, this ETF is comprised of about 500 holdings with heavy representation from information technology (~43%), consumer discretionary (~14%), health care (~13%) and industrials (8%). In 2022, that was not a pretty place to be.
Information technology has been hampered by monetary tightening as investors facing uncertainty and higher costs of capital make a beeline for firms with cash earnings instead of growth stocks with fancy projections. As discount rates rise, the net present value of cash flows for technology stocks move to the downside. All in, technology is not a great place to be as risk premiums increase.
Koyfin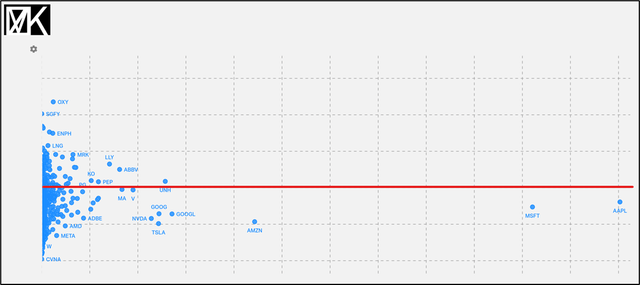
A large swathe of the underlying holdings, including big names such as (GOOG), (NVDA), (AMZN), (MSFT) and (AAPL) have found themselves underwater in 2022. Furthest to the right are the biggest holdings in the fund.
The same could be said with consumer discretionary. As restrictive monetary policy starts to bite, consumers start to tighten their belts accordingly. In hand, the first spend items to suffer are ones that are cyclical or discretionary. Think cars, televisions, cruise holidays, and luxury items.
This phenomenon can be witnessed in the returns of IWF during the year – information technology’s capitulation resulted in a -1,172-basis point contribution to returns while consumer discretionary weighed on gains too (-632 basis points).
Structure
IWF is made up of 516 constituents with a weighted average market cap of $719B. The prominence of mega-caps such as AAPL and MSFT contribute markedly to large, weighted fund capitalization. Average underlying price to earnings is high too (26x) reflective of the underpinning characteristics of big tech which makes up a meaningful part of fund composition.
The fund does provide a dividend yield (0.99%) even if it won’t be anything to exceptionally attract income investors. Options markets exist also, to be used in conjunction with a holding of the ETF, to customize risk exposure.
Overall, the fund provides good liquidity, a range of complementary options markets and even distributions. For money managers looking how this could fit into an overall portfolio, the fund holds a Beta of 0.92.
Koyfin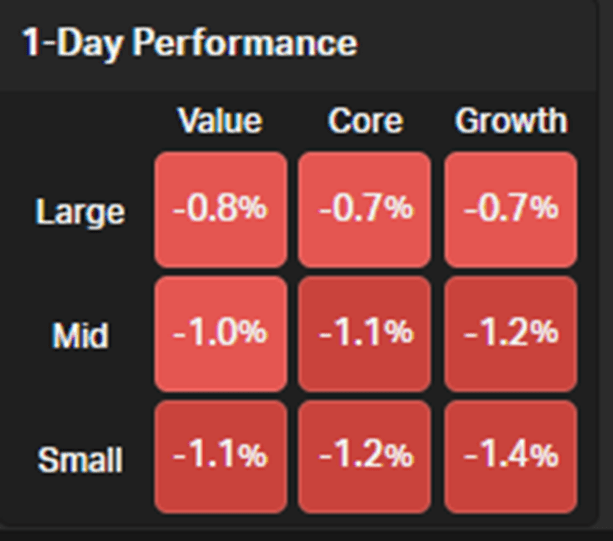
IWF tends to find itself positioned between large-cap growth and mid-cap growth. Note, in times of market volatility, it is the bottom right of the quadrant which generally suffers the most. The most defensive sectors are in the top-left of the quadrant.
Spreadsheet developed by author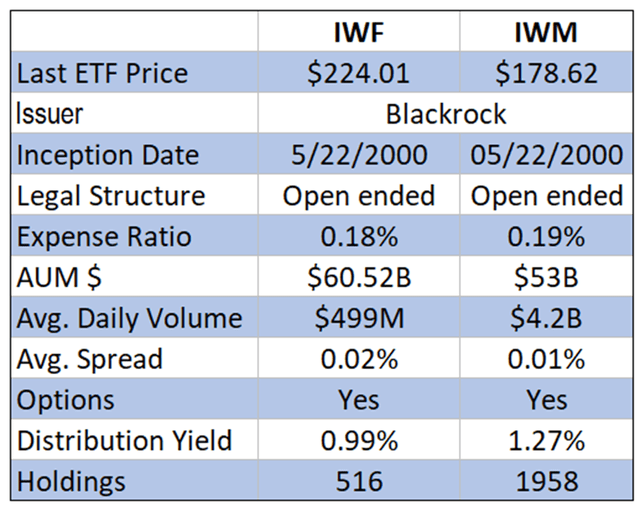
Comparative analysis IWF v IWM
Risk Profile
This ETF is pure vanilla in terms of structure, meaning it does not use derivatives, has no recourse to leverage or more exotic underpinning which entail counterparty risk.
It is appropriate for a long-term portfolio holding rather than a near-term trading vehicle. Most underlying risks relate to the fund’s heavy exposure to the growth side of the market. This looks likely to increasingly slow into 2023.
Key Takeaways
IWF – iShares Russell 1000 Growth – the distant cousin of IWM, the Russell 2000 small cap benchmark provides investors risk exposure to large US domestic focused equities with a penchant for technology, consumer discretionary and healthcare.
It is a fund that tends to front run bullish upside when market sentiment is positive. The same, however, is true and this fund is likely to lead the broader market to the downside as we enter 2023.