
Source. Mumbai’s luxury apartments and sprawling slums share the same area.
India’s Economy And Relative Economic Standing
India and Britain have a long and complicated history. 2019 represents a pinnacle moment as India, once Great Britain’s prized colony, is expected to overtake it in terms of economic prowess. HSBC analysts, and many others for that matter, predict India’s GDP to surpass that of France, Germany, and even Japan within the next decade. It’s already far ahead of ailing Russia. The consensus is that the world’s largest democracy will also grow approximately 1% faster than China over the same period.
Depending on political stability and adjustments made to mitigate challenging demographic trends, India and China are positioned to move into 3rd and 1st place, respectively, in terms of annual GDP sometime in the 2030s. That’s not as far away as one might think. As we saw with China, the majority of stock market gains often take place in the early and middle growth states.
Upside potential is also much higher for India which is expected to be one fifth of China’s economy at the time the latter overtakes the U.S. for number one.
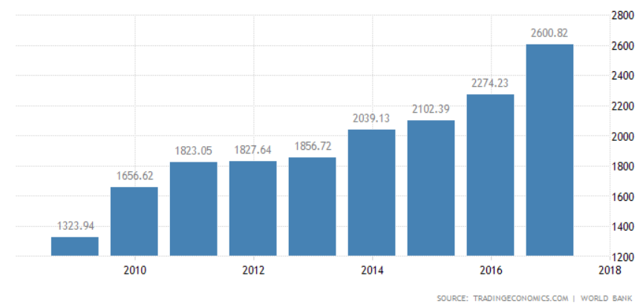
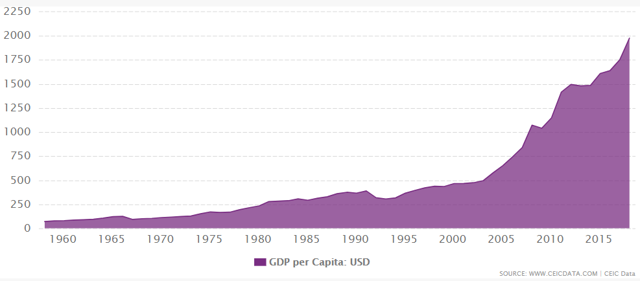
Indian GDP has risen tremendously since the end of the Great Recession. As of the end of 2018, the $2.7 trillion GDP economy has more than doubled since 2009 far outpacing that of China and almost every other nation. It is estimated to double again in the next 10 to 15 years. GDP per capita, a good measure of future growth potential and the ability for the population to increase investment, has been improving meaningfully as well.
The (Indian) Elephant In The Room: Demographics
India is 2.96 times more densely populated than China and is expected to overtake China as the most populous nation on earth in 2024 due to its 2.40 fertility rate (2015-2020) compared to China’s 1.63. How many people are aware that India will be larger than China by population in less than five years? Both countries suffer from a higher percentage of women (90-92 per 100 males) versus men which will cause challenges long term.
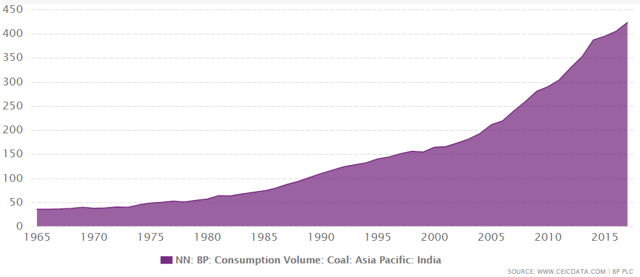
India’s dependence on coal consumption and its related pollution are two of the most severe challenges facing the growing nation.
Critically, India’s much lower median age of 26.7 is only two thirds of China’s 37.0. The U.S. is 38.0 and the UK’s is 40.2 for context and Scandinavian nations are even higher. The factors that lead to sustained periods of abnormal economic growth have been consistent over time. First, it is ideal to have a younger, fast growing, and at least adequately educated population. As populations age, the burden on government tends to grow and a lower percentage of national income goes into risky investments.
Second, adequate legal system and investor protections need to be in place including a government and regulatory system that at least tolerates capitalism. It’s not realistic or necessary to mimic that of the U.S. or UK (arguably the strongest duo in the world), but it can’t be a complete disaster either. China is a good example of having significant issues but still managing to achieve the minimal threshold for foreign investment and the recycling of organically created capital (rather than it immediately fleeing the country). This is associated with a healthy and trusted banking sector.
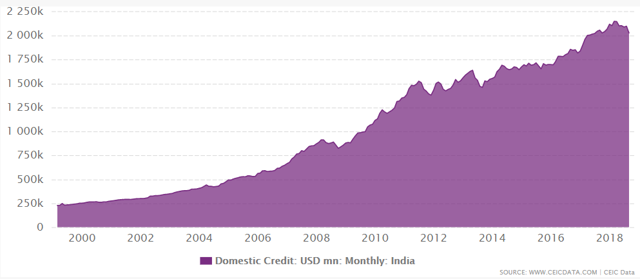
Domestic credit in USD is shown above. It has grown linearly over time and now exceeds $2 trillion.
The next factor is political congruity which is usually but not always associated with a functioning democracy. Again, China is a great example of consistency and stability being more important than which dead philosopher’s approach the nation takes. Note the words chosen – developing nations are not going to have banking systems mirroring that of Switzerland or the political stability of Canada. These systems just need to be good enough not to create a total log jam as organic economic growth due to investment, technology, and growing populations runs its course.

Source
While India has a staggeringly complex political dynamic and a very serious security concern in the form of Pakistan and terrorist groups, it has made substantial progress and continues to do so. We want lots of problems and challenges. The solving of those issues is what results in massive gains on our investment and the movement of millions out of abject poverty. India is slowly but surely evolving toward embodying all three key elements necessary for long periods of strong economic growth.
Investment Options And Past Performance
As we discussed in our articles on opportunities in Argentina and Turkey, there are times funds make sense. While we at Williams Equity Research tend to focus on individual stocks almost exclusively, it is important to remember why. We choose individual stocks because our research and data suggests they are usually the best way to achieve our objectives. We don’t invest in individual stocks over funds due to a rigid philosophy or personal bias. Instead, we use whatever investment vehicle has the highest probability of success. Due to portfolio size constraints, diversification needs, limited time for ongoing due diligence, and or legal/regulatory restrictions, sometimes going the fund route makes the most sense. This article analyzes those options while Part II focuses on individual stocks.
Since 2009, the Indian and U.S. stock markets have had an only modest correlation of +0.29 meaning Indian investments have also added true diversification to portfolios concentrated in U.S. stocks. The largest individual stock ADRs include Infosys (INFY), HDFC Bank Limited (HDB), ICICI Bank Limited (IBN), Tata Motors (TTM), Wipro, Ltd. (WIT) and Vedanta (VEDL); this is the complete list of Indian companies trading on U.S. exchanges with market capitalizations of at least $10 billion as far as we know. Sector diversification is common for a developing market with a concentration in banks followed by IT/Software and one entrant each from the automotive and mining sectors.
Our portfolio managers made significant personal investments in Tata Motors in late 2018 as well as a mutual fund which we’ll discuss shortly. It is worth noting that this is the only traditional mutual fund our head PM owns outside of his 401(k). Let’s take a look at how this basket of individual stock ADRs has performed in the last 24 months which includes an overall trend of stable global growth but also the extremely sharp sell-off in most emerging markets last year.
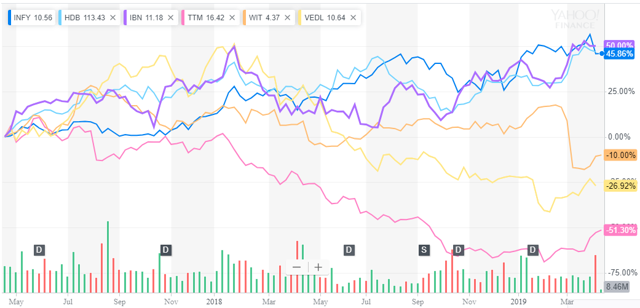
Source: Yahoo! Finance
This two-year chart is telling. The three best performing of the six largest Indian ADRs were up 26.9% on average in capital gains. The bottom half were down 39.0% over the period. Talk about dispersion. There are a little over a dozen India-focused ETFs but only the below have meaningful assets.
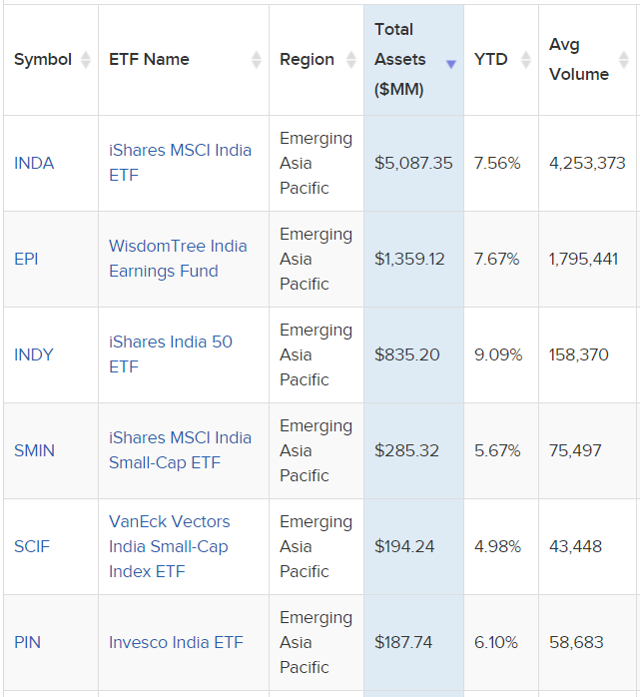
Source
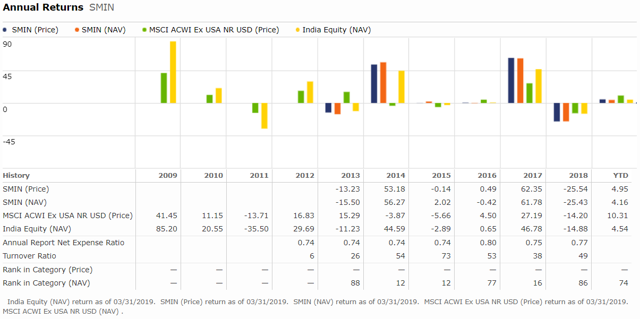
WisdomTree India Earnings Fund (EPI) is one of two with over a billion in assets and its holdings have an average market cap of $14.5 billion. EPI has consistently trailed the India Equity Morningstar benchmark by 200 basis points annualized and particularly so after 2014. The iShares India 50 (INDY) is a true giant market cap fund with the average company size coming in at $35.6 billion. Unsurprisingly, it has similar performance issues as EPI. The iShares MSCI India Small-Cap ETF (SMIN) looks promising with a heavy weight to mid-cap Indian stocks but its track record only extends back to 2012. Since that time, however, it has done well. If we had data going back to the volatile period of 2009-2012, we’d have more certainty one way or the other. The India Equity Morningstar index gained 85.2% in 2009 and we simply don’t know how SMIN would have done.
Source
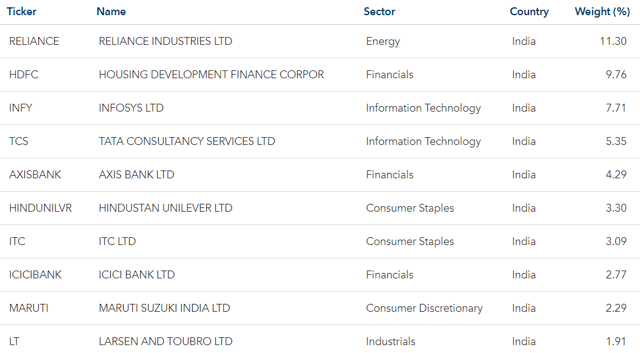
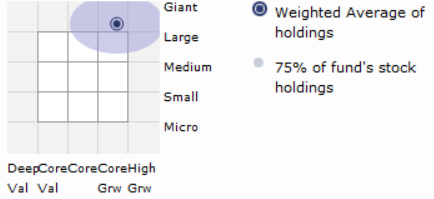
Let’s compare the six major individual stock ADRs mentioned previously to the iShares India ETF (INDA). It is the ETF heavyweight with more than double the AUM of all other India ETFs combined. The allocation to large cap stocks is in between that of the WisdomTree India Earnings Fund and the iShares India 50. Its two-year performance of 14.0% is approximately in the middle of the pack as well. On a five-year basis, the situation is similar with INDA up 35% and HDB leading the individual ADR pack at 187.22% and TTM in last place at -56.03% (all cited are capital gains only) over the time period.
Source
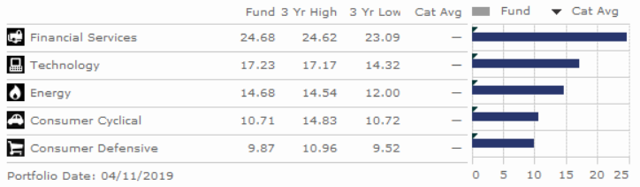
The ETF is not all that well-diversified with the top five and top 10 holdings representing 38.41% and 51.77%, respectively, of the fund. Its expense ratio of 0.68% is average for the type of fund.
Source
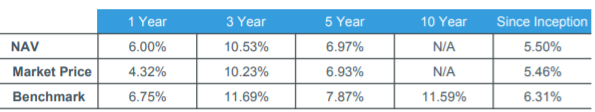
INDA has trailed the benchmark by about 100 basis points (1.0%) annually since inception which has been consistent over shorter and longer time periods. To BlackRock’s credit, this is better than the other ETFs with significant AUM. While not bad in terms of construction and performance, it’s still heavily weighted toward large cap stocks and financial services which is a common problem with emerging market ETFs.
Source: Morningstar
Source: Morningstar
Most of the growth in emerging and developing markets takes place through small and mid-cap stocks (this also applies to developed markets). A traditional ETF, however, has trouble obtaining enough scale and liquidity investing in stocks with smaller market capitalizations. We are missing the strongest growth areas if we only invest in giant-cap stocks like in INDA, EPI, and INDY. For those that want passive exposure to the fastest growing elements of the India stock market and don’t mind the limited track record, we recommend considering the iShares MSCI India Small-Cap ETF. While the iShares India ETF is also a decent tool to obtain exposure to the largest stocks in India, and likely the best Indian ETF with significant AUM, let’s see what the closed-end space has to offer.
Source: Morningstar
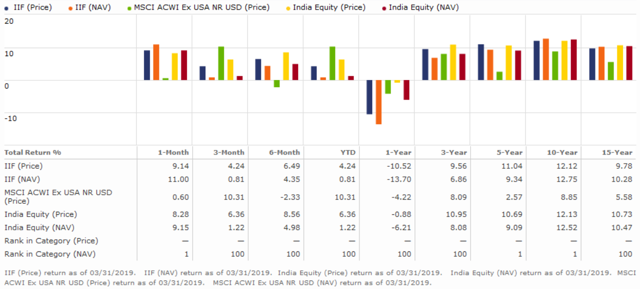
This is a detailed comparison of MS India Investment Fund (IIF), which is structured as a closed-end fund (“CEF”), versus several benchmarks. We’ll explain why we consider it best of breed. Right away, we can see that IIF has earned double the return of the iShares India ETF since the latter’s inception. Much of this has to do with the portfolio manager’s focus in mid rather than large-cap stocks. IIF’s smaller size and active management style make this feasible. It has beaten the MSCI ACWI Ex USA index over the last 15, 10, five, and three years. It trades at a 10% discount to NAV allowing investors to purchase shares at a discount (that doesn’t mean the discount will be alleviated when you sell – and it probably won’t).
The CEF has been around since Q1 1994 which is an incredibly long track record for a fund of this type. Ruchir Sharma has been the head portfolio manager since 2001 or nearly the entire life of the fund. The other two portfolio managers both have real world investing experience in India and went to college there. Mr. Sharma is also Morgan Stanley’s Head of Global Markets and Chief Global Strategist. We wouldn’t normally be able to obtain a portfolio manager of this quality for a $332 million fund. The fees at 1.35% annually are high but about average for an emerging markets focused closed-end fund. IIF has posted very strong results with the exception of 2018.
Source
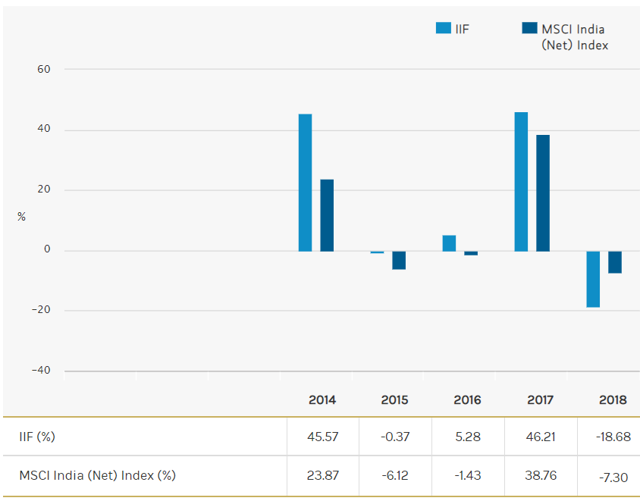
In fact, IIF experienced over 45% annual returns in 2014 and 2017 which beat the index MSCI India Index by approximately 21.7% (2014) and 7.5% (2017). Many of the less diligent are turned away by IIF simply by looking at the long-term chart but they don’t understand the complete picture.
Source
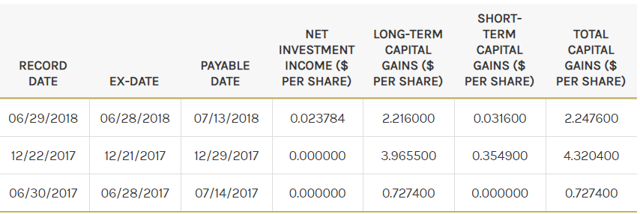
A policy of IIF is to pay out capital gains to shareholders over time. In 2017 and 2018 alone, shareholders received $6.57 per share in capital gains distributions. To put that into context, the shares currently trade at only $21.06. Most finance-oriented services do not include this distribution as part of the fund’s total return.
Equally as compelling as IIF’s unique approach, strong performance, and consistent management team is how the fund is positioned today. It’s currently beginning to recover from one of its worst years (2018) which we expect to provide investors with a favorable entry point.
Source
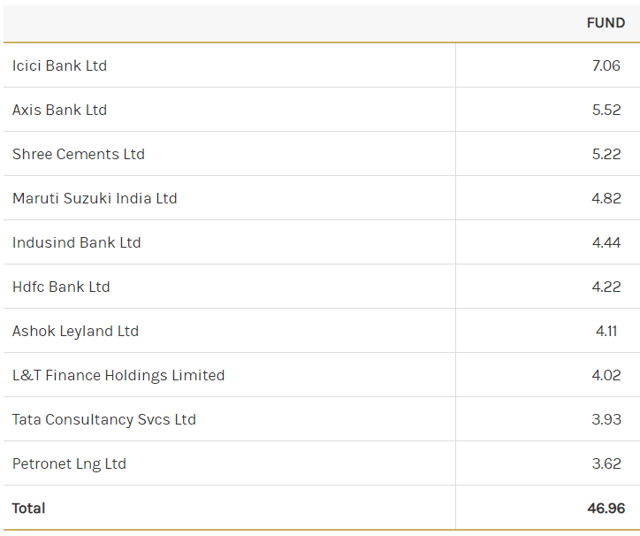
IIF is better diversified than the iShares India fund with the largest holding at only 7.06% of the fund instead of INDA’s 11.3%. The weighting to the top three and top five are approximately half that of INDA’s. IIF’s exposure to financials is high at 33.26% but is otherwise well-diversified by sector with no others above 20% and only Industrials between 10% and 20% of the fund.
Overall, we believe IIF is currently the best fund vehicle to take advantage of India’s long-term outlook and our lead PM holds a large position in the fund acquired during the emerging markets crises in 2018. Our next analysis on India will provide an analysis of individual stocks so stay tuned.
As always, we appreciate all who take the time to read and comment. – WER Portfolio Managers
Thank you for reading!
Interested in more income recommendations across traditional and nontraditional asset classes including real-time alerts?  Start a free trial of our Institutional Income Plus service. Learn about our institutional investing approach built through experience not just books. Join the community to access this week’s recommendations, and specific entry and exit targets in real-time, involving BDCs, REITs, Preferred Equity, and many others. We have an all-inclusive income model portfolio, allocation guidelines, and issue bi-weekly market commentary.
Disclosure: I am/we are long IIF, TTM. I wrote this article myself, and it expresses my own opinions. I am not receiving compensation for it (other than from Seeking Alpha). I have no business relationship with any company whose stock is mentioned in this article.