
The market has seemingly done a complete about-face following the bloodbath that was the waning months of 2018. Since the December 26th session, the S&P 500 finished higher 14 of 16 trading days and recaptured nearly half of the losses it sustained by its December 24th low.
Were our fears of a recession overblown? Quite possibly, but that doesn’t mean the current comeback isn’t also a symptom of an uncertain economic picture.
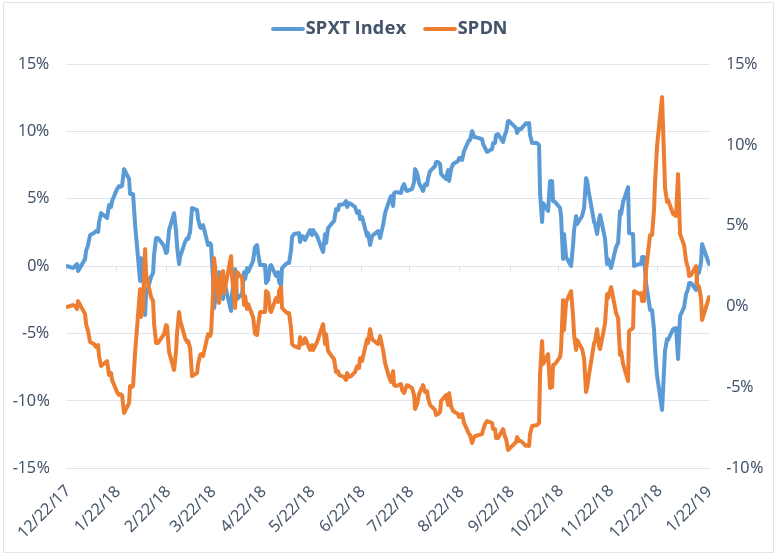
First, consider exactly where the S&P 500 is relative to its prior performance. Take a look at the chart below, which show the past 13 months of the S&P 500 alongside the performance of the Direxion Daily S&P 500 Bear 1X Shares (NYSE: SPDN), which attempts to return the inverse of the daily performance of the S&P 500 Index.
With a net expense ratio of just 45* basis points, SPDN is the lower cost alternative to other inverse ETFs that track the index.
Data Range: 12/22/2019 – 1/22/2019. Source: Bloomberg. The performance data quoted represents past performance. Past performance does not guarantee future results. The investment return and principal value of an investment will fluctuate. An investor’s shares, when redeemed, may be worth more or less than their original cost; current performance may be lower or higher than the performance quoted. For standardized performance and the most recent month-end performance, click here.
One of the most striking things you might first notice in the chart is how close to parity the index and its counterpoint have been since October. The two charts rebound off one another’s 2018 entry three or four times between mid-October and the end of November before finally making a definitive cross in December.
But what’s truly telling about this chart is what took place, and is taking place, in January of each year. Over both January 2018 and January 2019, the market exhibited large and consistent growth over a fairly extended period of time.
Between the 21 days that spanned the open on January 2nd and the close on the 31st, the S&P 500 gained more than 5.5 percent. Prior to the 29th, it was actually on pace to post over 6 percent for the month prior to the 29th.
Compare that to the recent rally, which, between the 2nd and the 17th, has put the index up 5.8 percent. Pulled back to include the final few days of December, that pace increases to more than 11.5 percent over 16 trading days. While some of the daily gains have been larger than others, that is a lot of ground to cover in a short period of time.
Finally, there’s the chart parity. Both the index and the bear fund are again approaching a cross at their 2018 starting prices. Bear in mind that CBOE’s volatility index is still about where it was through October and November, 2018, which coincided with some of the market’s biggest down days of the year. As in previous months with heightened volatility, it might not be entirely odd to see similar dramatic volatility in the months to come, as buyers and sellers fight it out as to whether to dig further out of the 2018 hole.
However, that is all based on historical information and trend. What might truly turn the market back to the negative is economic, governmental and global unrest.