")
Richard Drury
This ETF review series aims at evaluating products regarding their strategies, portfolios and past performances. As holdings and weights change over time, updated reviews are posted when necessary.
FGD strategy and portfolio
The First Trust Dow Jones Global Select Dividend Index ETF (NYSEARCA:FGD) has been tracking the Dow Jones Global Select Dividend Index since 11/21/2007. As of writing, it has 98 holdings, a distribution yield of 6.96% and a total expense ratio of 0.57%. It pays quarterly distributions.
As described by First Trust, eligible companies are listed in 25 developed markets. They must show:
- A current-year dividend per share greater than or equal to the five-year average.
- A maximum 5-year average payout ratio of 60% for U.S. and Europe, or 80% for other countries.
- A minimum average daily trading volume of $3 million.
Eligible stocks are ranked in descending IAD yield order. At every reconstitution, existing constituents stay in the index if they are in the top 150. Excluded stocks are replaced with the best-ranked eligible stocks, until the count reaches 100. Constituents are weighted based on IAD yields and capped to 10% each. The index is rebalanced once a year in March.
The fund is quite balanced between large cap (about 46% of asset value) and mid-caps (about 41%). South Korea is the heaviest country in the portfolio (almost 14%). The U.K., Spain, Japan, Canada and the U.S. are between 8% and 10%. Hong Kong weighs 7.25%, which represents a moderate exposure to geopolitical and regulatory risks related to China. The next chart plots the top 10 countries, representing about 82% of asset value.
FGD countries (chart: author; data: First Trust.)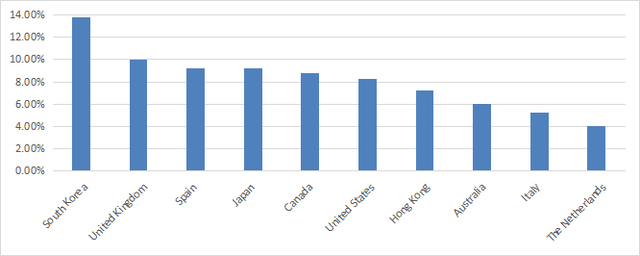
Financials represent 44.8% of asset value. Other sectors are below 11%. The fund ignores technology and healthcare.
FGD sectors (chart: author; data: First Trust.)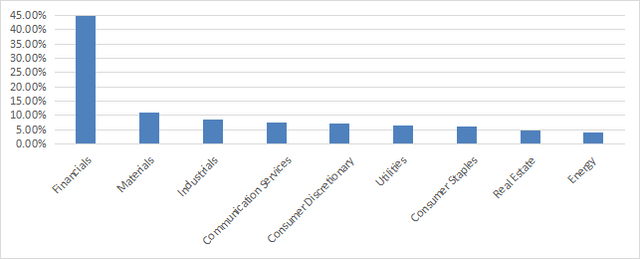
The top 10 holdings, listed below, represent 17% of asset value. The heaviest one weighs about 3%, so risks related to individual companies are moderate.
|
Name |
Identifier |
Classification |
Weighting |
|
Fortescue Metals Group Limited |
FMG.AU |
Materials |
3.03% |
|
Compania de Distribucion Integral Logista Holdings, S.A. |
LOG.SM |
Industrials |
1.96% |
|
ACS, Actividades de Construccion y Servicios, S.A. |
ACS.SM |
Industrials |
1.62% |
|
Rio Tinto Plc |
RIO.LN |
Materials |
1.60% |
|
Mitsui O.S.K. Lines, Ltd. |
9104.JP |
Industrials |
1.59% |
|
A.P. Moller – Maersk A/S (Class A) |
MAERSKA.DC |
Industrials |
1.57% |
|
Japan Tobacco, Inc. |
2914.JP |
Cons. Staples |
1.50% |
|
Mapfre S.A. |
MAP.SM |
Financials |
1.45% |
|
Enagas S.A. |
ENG.SM |
Utilities |
1.32% |
|
UnipolSai Assicurazioni SpA |
US.IM |
Financials |
1.32% |
(source: First Trust)
Past performance compared to competitors
FGD has a loose dividend growth rule based on the 5-year average yield, but it is more focused on higher yields. The next table compares the fund’s performance and risk metrics with other non-hedged international dividend funds since 1/1/2016: Schwab Fundamental International Large Co. Index ETF (FNDF), iShares International Select Dividend ETF (IDV), First Trust S&P International Dividend Aristocrats Fund (FID), SPDR S&P Global Dividend ETF (WDIV), MSCI EAFE High Dividend Yield Equity ETF (HDEF), and Global X SuperDividend ETF (SDIV).
|
Total Return |
Annual.Return |
Drawdown |
Sharpe ratio |
Volatility |
|
|
FGD |
47.87% |
5.80% |
-43.26% |
0.36 |
19.00% |
|
FNDF |
51.64% |
6.19% |
-40.09% |
0.43 |
17.24% |
|
IDV |
40.98% |
5.08% |
-41.64% |
0.34 |
18.59% |
|
FID |
25.17% |
3.29% |
-38.96% |
0.28 |
17.52% |
|
WDIV |
43.38% |
5.33% |
-40.11% |
0.35 |
16.89% |
|
HDEF |
37.33% |
4.68% |
-36.87% |
0.34 |
15.84% |
|
SDIV |
-24.08% |
-3.89% |
-56.62% |
-0.05 |
22.66% |
Data calculated with Portfolio123
FGD is second to FNDF in total return and risk-adjusted performance (Sharpe ratio). International markets have underperformed U.S. stocks by a wide margin in this period: the S&P 500 (SPY) shows a total return of 121.4% in the same time.
In the last 12 months, FGD has been in the middle of the pack (next chart). HDEF has been the best performer in 2022, and SDIV is the worst one by far in both time frames.
FGD vs competitors, last 12 months (Portfolio123)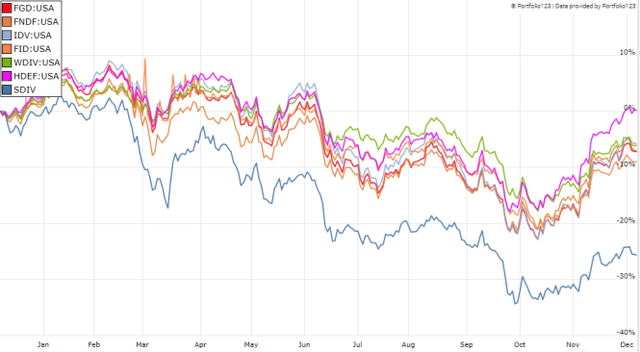
Since inception, FGD share price has lost 32%. It has gone sideways since the second half of 2009. This points to significant decay in inflation-adjusted assets per share.
Share price (without dividend) (Trading View on Seeking Alpha)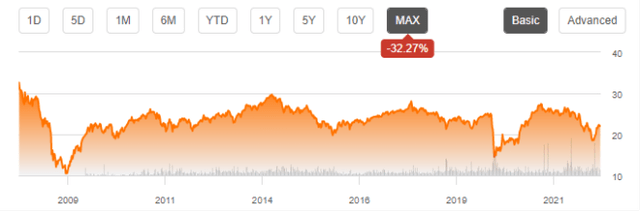
The annual sum of distributions went up from $1.00 in 2010 to $1.34 in 2021 (source). The fund deserves a dividend growth label, which doesn’t eliminate concerns about capital decay.
Takeaway
FGD holds 98 international high-dividend stocks with yields over their 5-year average. It is invested exclusively in developed countries, South Korea holding the 1st rank in asset value (14%). It has a moderate exposure to risks related to China through Hong Kong listed companies (7.25%). Financials represent about 45% of asset value, which I find excessive. Relative to other international dividend ETFs, the fund has performed honorably. Distributions have been growing in a decade, but the share price has been on a rollercoaster with no trend. In inflation-adjusted value, long-term shareholders have lost in capital. For transparency, a dividend-oriented part of my equity investments is split between a passive ETF allocation and my actively managed Stability portfolio (14 stocks), disclosed and updated in Quantitative Risk & Value.