
peterschreiber.media/iStock via Getty Images
On November 12, 2021, in conjunction with the Hoya Capital Income Builder (hereafter HCIB) marketplace service, I introduced the ETF Reliable Retirement Portfolio (hereafter ETFRRP).
On April 6,2022, I offered the 2022 Q1 update on the portfolio. I referred to this quarter as “the quarter the world shifted,” largely based on Vladimir V. Putin’s decision to invade Ukraine.
For a complete discussion of the theory behind the initial portfolio construction, as well as the starting balance and positions, please feel free to reference the articles referenced above. In the next section, however, I will offer an abbreviated overview of key data points and concepts to lay a groundwork for the performance update that is ultimately the subject of this article.
Portfolio Structure And Themes
Based on 2022 investment outlooks from several reputable sources, here are the key themes that drove portfolio construction.
- A bias toward value stocks in the U.S. – Of late, a relatively small subset of U.S. growth stocks has significantly outperformed virtually every other asset class. Various analyses suggest that value stocks may offer a better risk/reward profile moving forward.
- The return from U.S. equities may be only marginally higher than bonds – Particularly for retirees, finding a solid balance of risk/reward is worthy of consideration. I attempt to find this balance in my portfolio.
- Superior growth opportunities may come from outside the U.S. – A mid-year 2021 update from Vanguard forecast Euro-area stocks as potentially outperforming their U.S. cousins by roughly one-half percent; a range of 2.9% – 4.9% as opposed to 2.4% – 4.4%. And emerging markets offered even higher potential, albeit with more volatility and risk.
Below, I have reproduced the table of ETFs included in the portfolio. However, the weightings are proprietary to subscribers of Hoya Capital Income Builder.
ETF Reliable Retirement Portfolio by ETF Monkey (Hoya Capital Income Builder)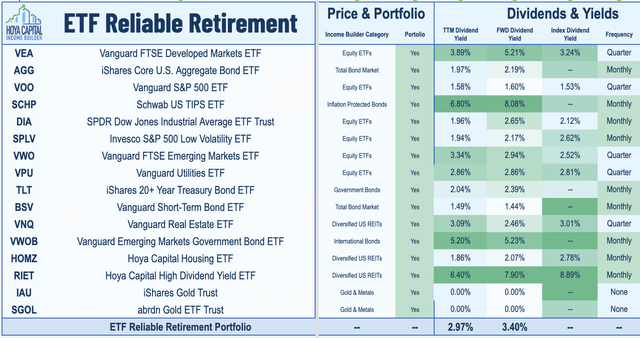
At a high level, the portfolio is comprised of five asset classes:
- U.S. Stocks
- Foreign Stocks
- Bonds/TIPS
- Real Estate
- Gold.
As a conclusion to this section, I might note that, while a high dividend level was not the primary focus of this portfolio, nine of the 14 dividend-producing ETFs pay their dividends monthly, with the remaining five paying quarterly. The two gold-backed ETFs, of course, pay no dividends.
2022 Q2 Update: Where The Rubber Meets The Road
In Q2, the S&P 500 posted a more than 16% quarterly loss – its biggest one-quarter fall since March 2020, according to this article from CNBC.
The Dow and Nasdaq were not spared from the onslaught. The 30-stock Dow lost 11.3% in the second quarter. The Nasdaq, meanwhile, suffered its biggest quarterly drop since 2008, losing 22.4%.
Over that same period, the ETFRRP experienced a decline of 10.05%, falling from a balance of 484,270.31 as of Q1 to 435,624.59, as shown below.
ETF Reliable Retirement Portfolio – Dashboard (Author-Developed Tracking Sheet)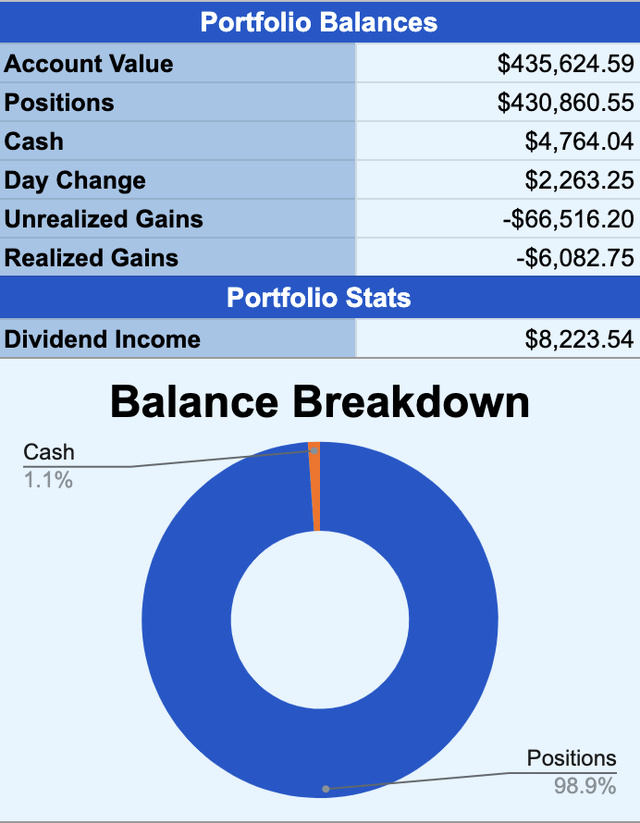
Before we go any further, let me share two tweets that graphically display just how bad the first half of 2022 was.
First, from our friend Callum Thomas, of Topdown Charts. As can be seen, with the exception of cash and commodities, a virtual wipeout for every other asset class.
What did this lead to, for the classic 60/40 portfolio? Here’s Charlie Bilello.
Given that, how did the ETFRRP do?
As a benchmark for evaluation, I ran a comparison in Portfolio Visualizer against the Vanguard Balanced Index, as represented by a mutual fund such as Vanguard Balanced Index Fund Admiral Shares (VBIAX). In the analysis, I set the flag to include, and reinvest, all dividends. Here are the results.
2022 Q2 Returns – ETFRRP vs. Vanguard Balanced Index (PortfolioVisualizer.com)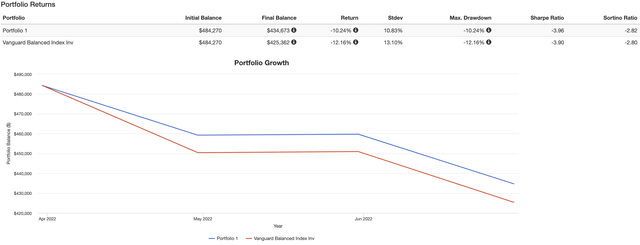
If you look carefully at the above, based on my Q1 starting point of $484,270, Portfolio Visualizer calculated an ending balance for the portfolio roughly $1,000 different from my actual. Since my Portfolio Visualizer analysis is based on my ending positions on 6/20, and I executed a couple of minor rebalancing and other transactions during the quarter, the minor variance is quite acceptable.
All in all, then, I find myself happy with how the portfolio performed. In every metric across the results line, the ETF Reliable Retirement Portfolio slightly outperformed the Vanguard index. Notably, even though I will be brutally honest about what I view as my successes and failures in my commentary to follow, I take comfort that I slightly outperformed the classic 60/40 mix of stocks and bonds represented by VBIAX.
Let’s break things down, then, by asset class.
U.S. Stocks
As reflected in my Q1 report, Invesco S&P 500 Low Volatility ETF (NYSEARCA:SPLV) and Vanguard Utilities ETF (VPU) were my most prescient inclusions in the portfolio, both actually rising in value.
While Q2 was not quite as good, SPLV and VPU managed to limit their declines to 7.59% and 5.85%, respectively. Since both ETFs also generate handsome dividends, the overall loss was even less.
Let me take a brief diversion to feature SPLV. A few months back, I did a full review of this ETF. Since the time of that writing, this ETF has justified my faith in it, holding up extremely well during the current downturn.
In the below graphic from SPLV’s webpage on Seeking Alpha, we get some idea why.
SPLV – Sector Weightings and Top 10 Holdings (Seeking Alpha)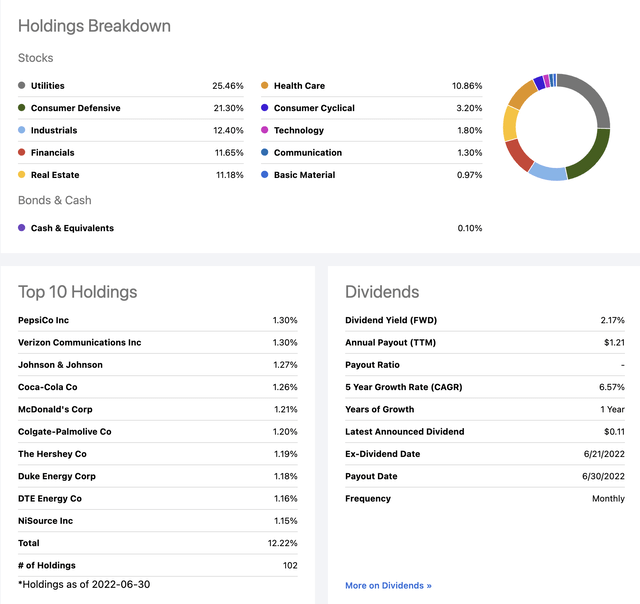
Certainly, the fund’s robust weighting in Utilities has made it a winner in recent history. Combine that with its second-highest weighted sector, Consumer Defensive, and it continues to be an excellent holding during this period of market turbulence. On top of all of that, SPLV pays a monthly dividend. Who could ask for more?
This past April, my article VOO Vs. VTI: Picking A Winner From 2 Excellent Vanguard ETFs was selected as an Editor’s Pick and was by far my most-read article of the year. As a result, I ended up swapping Vanguard S&P 500 ETF (NYSEARCA:VOO) for Vanguard Total Stock Market ETF (NYSEARCA:VTI) in ETFRRP.
Foreign Stocks
As we all know, Russia’s war against Ukraine has only intensified since the close of Q1. Following some early embarrassments, after apparently believing they would be able to execute a lightning strike and quick takeover of Kiev, Russia has adjusted its military strategy. As a result, European economies are experiencing tremendous difficulty.
As a result, my two ETFs of choice, Vanguard FTSE Developed Markets ETF (VEA) and Vanguard FTSE Emerging Markets ETF (VWO), experienced declines of 15.05% and 9.71%, respectively, over the period covered by this report.
At the same time, readers may be interested in my recent article VXUS: Past Performance Is No Guarantee Of Future Results. It offers a perspective that may at least be worth pondering.
Bonds/TIPS
In various articles, including this recent example, I argue that bonds deserve at least some place in every portfolio. In this particular period, that advice has come with a cost. Let’s start with the 3 ETFs I selected for my bond allocation.
Over this period, Vanguard Short-Term Bond ETF (BSV), iShares Core U.S. Aggregate Bond ETF (AGG), and iShares 20+ Year Treasury Bond ETF (TLT) declined by 1.42%, 5.06%, and a whopping 13.02%, respectively.
In hindsight, I underestimated the amount of damage that was going to be done to longer-term bonds. There really is no way to sugarcoat it. I will note that during Q2 I shortened my overall duration slightly, and also decreased my overall weighting in bonds in favor of stocks, following the market’s decline into bear territory.
In terms of TIPS, the Schwab U.S. TIPS ETF (SCHP) declined by 8.08% during Q2. At the same time, this was offset somewhat by 2.07% in dividends received, calculated against the balance as of the end of Q1.
Finally, I included a small weighting in Vanguard Emerging Markets Government Bond ETF (VWOB) in the portfolio, calling it “perhaps the most adventurous ETF in the portfolio.” As it turned out, VWOB continued to be a little more adventurous than I would have hoped! In terms of price, it declined by some 12.25% during Q2, offset somewhat by 0.93% in dividends received, calculated against the balance as of the end of Q1.
Real Estate
This asset class was hit hard during Q2, to put it mildly. My 3 selected ETFs all experienced very similar losses, ranging from 15.92% to 17.52% in terms of price. Together, the 3 ETFs pulled in $424.13 in dividends, approximately 1% of the combined balance at the end of Q1.
Gold
Compared to several of the other asset classes, gold held up relatively well, with an overall decline of 6.72% during the quarter. Since the inception of the portfolio, gold has been roughly flat.
Earlier, I featured that the portfolio experienced a smaller decline than my benchmark, the Vanguard Balanced Index. The performance of gold is likely a major reason for this.
Summary And Outlook
I think by now, it is pretty clear that the first half of 2022 is one that most investors would prefer to forget.
What about moving forward? Sadly, I am in the camp that expects things to get a little worse before they get better.
A couple of months back, I wrote a fairly comprehensive summary of a recent note from Zoltan Pozsar, Investment Strategist at Credit Suisse.
Here’s one excerpt from that note:
At 4,000, the Fed does not seem content, and in the grand scheme of things . . .. At 3,500, we would have lost all of the post-pandemic gains in market wealth, but that level for stocks still feels like a put option, just with a lower strike price. At 2,500, we would lose not only all of the post-pandemic gains, but would eat into some of the pre-pandemic gains too. And if something indeed happened to the supply of labor post-pandemic (and some of that is wealth related), then to cool price pressures, maybe a pre-pandemic wealth level is appropriate indeed.
Based on that, what am I pondering, both in my personal portfolio as well as for the ETFRRP? I’ll leave you with what I wrote in the comments section of a follow-up discussion thread I posted based on the Pozsar piece.
My takeaway is that the next key area I am watching for is right around 3,500-3,600. At 3,600, you have a 25% decline in the S&P.
At about 3,400, we would be back to the levels immediately preceding the COVID-19 panic in late-February, 2020.
Far lower, at roughly 2,400-2,500, we would be at the December, 2018 mini-crash.
Bearing in mind that, as a retiree, I need to remain somewhat cautious with my allocation, I feel like I might be willing to move to 55% stocks at 3,600. Perhaps 56% at 3,400.
The question I am wrestling with now is: Would I be willing to go as high as 60% on my stock allocation? And, if so, at what level? I believe I would be happy to do so if by some crazy chance we got to 2,500. If I split the difference, that would imply a 58% weighting somewhere around the 2,900-3,000 range.
I wrote that roughly a month ago, and I haven’t seen anything yet that materially changes my view.
Thanks for reading! Until next time, I wish you…
Happy Investing!!